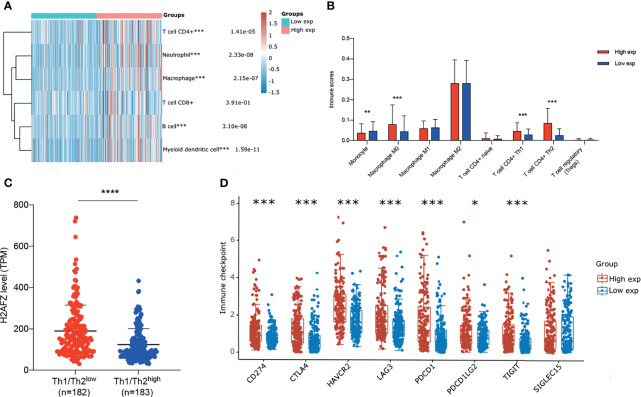
Figure 9.
Correlation of H2AFZ and immune infiltrations in HCC. (A) The score distribution of CD4+ T cells, neutrophils, macrophages, CD8+ T cells, B cells, and myeloid dendritic cells in the H2AFZhigh group and H2AFZlow group, estimated by TIMER. (B) Scores of monocytes, macrophage M0, macrophage M1, macrophage M2, naive CD4+ T cells, Th1 cells, Th2 cells, and Tregs in the H2AFZhigh group and the H2AFZlow group, estimated by CIBERSORT and xCell (Mann–Whitney tests, *p < 0.05, **p < 0.001, ***p < 0.0001). (C) Differential H2AFZ expression level in Th1/Th2high patients and Th1/Th2low patients (Mann–Whitney test, p < 0.00001). (D) Expression levels of immune-checkpoint-relevant transcripts in the H2AFZhigh and H2AFZlow group, respectively (Mann–Whitney tests, *p < 0.05, **p < 0.001, ***p < 0.0001).

