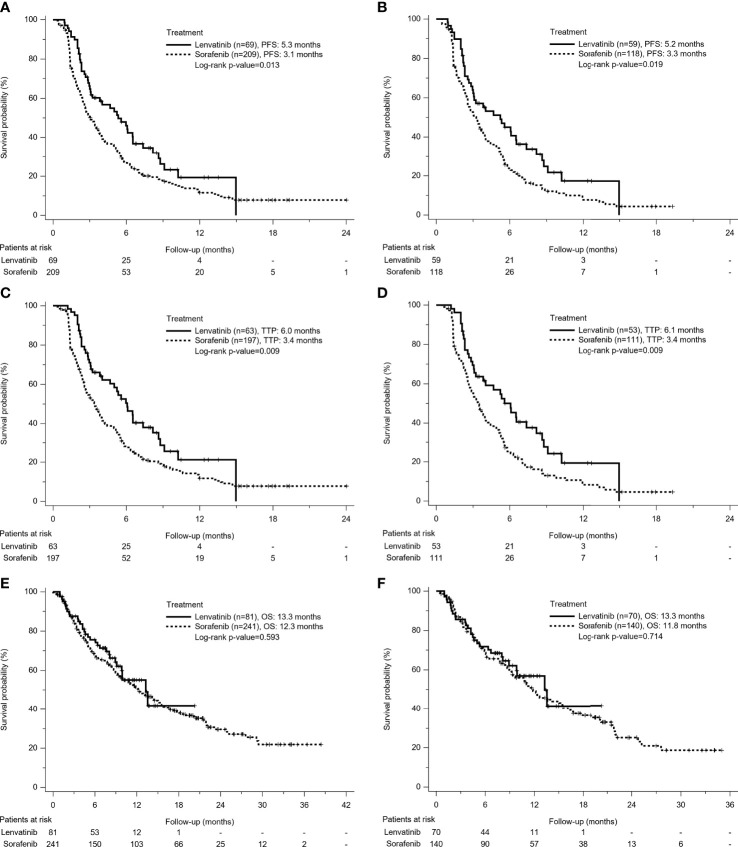
Figure 1.
Kaplan-Meier survival curves of treatment outcomes including (A) Before Propensity Score (PS)-matched Progression-Free Survival (PFS), (B) After PS-matched PFS, (C) Before PS-matched Time to Progression (TTP), (D) After PS-matched TTP, (E) Before PS-matched Overall Survival (OS), and (F) After PS-matched OS between the Lenvatinib and Sorafenib groups. The Lenvatinib group had superior PFS and TTP, but similar OS to the Sorafenib group, no matter for either before or after PS matching analysis.

