Figure 2.
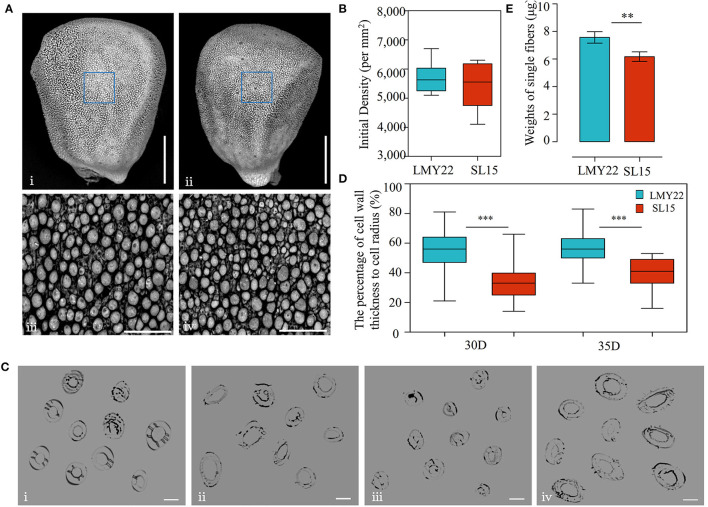
Detection of fiber initiation and cell wall thickness. (A) TEM view of fiber initiation at 0 DPA; (i) and (ii) present the whole ovule of LMY22 and SL15, respectively, scale bar, 500 μm; (iii) and (iv) present close-up views of LMY22 and SL15, respectively, scale bar, 50 μm. (B) Counts of fiber initiations, mean ± s.d., n = 20. (C) Cross-sections of cotton fiber cells; (i) and (ii) present LMY22 and SL15 at 30 DPA, respectively; (iii) and (iv) present LMY22 and SL15 at 35 DPA, respectively; scale bar, 20 μm. (D) Ratio of cell wall thickness to cell radius (as percentage), mean ± s.d., n = 100, ***P < 0.001. (E) Weights of single fibers, mean ± s.d., n = 50, **P < 0.01 and ***P < 0.001.

