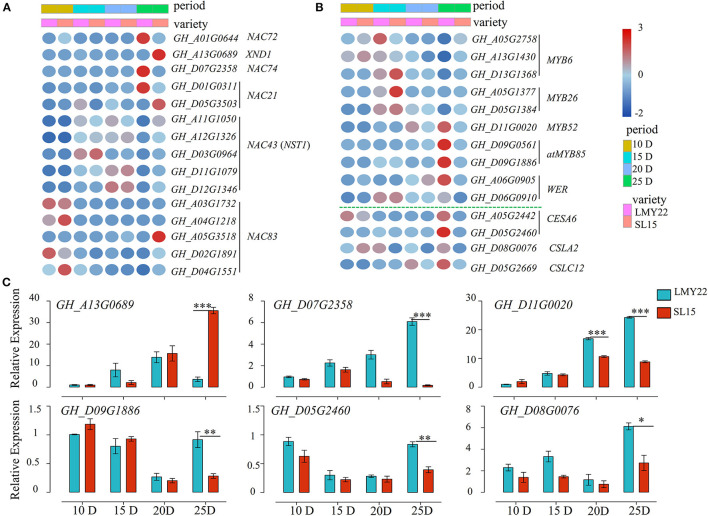
Figure 5.
Expression patterns of genes in the NAC-MYB-CESA network. (A) Heat map for DEGs encoding NAC transcription factors. (B) Heat map for DEGs encoding MYB-like transcription factors and cellulose synthase/synthase-like genes. (C) Expression of six DEGs as determined by qRT-PCR. *P < 0.05, **P < 0.01, and ***P < 0.001.

