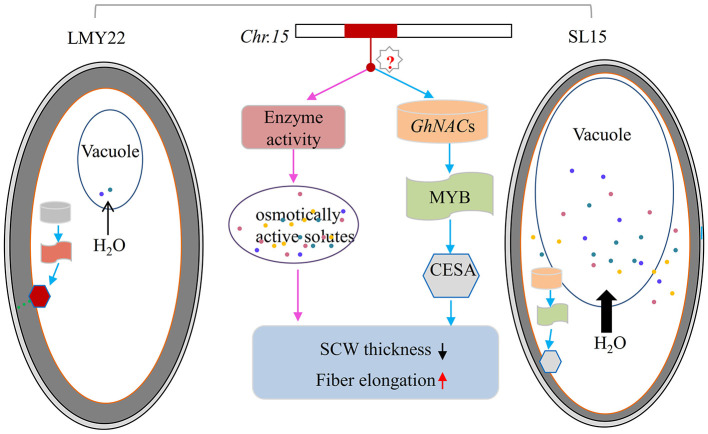
Figure 7.
Model of fiber secondary cell wall thickening in LMY22 and SL15. Light gray and dark gray ovals respectively represent the cotton fiber primary cell wall and secondary cell wall (SCW); the orange oval represents the plasmalemma of the cotton fiber cell. Cylinders represent GhNACs that negatively regulate fiber SCW development, with orange and light gray indicating DEGs with up- or downregulated expression, respectively. Oblong waves represent MYBs involved in cellulose biosynthesis, with brick red and light green indicating DEGs with up- or downregulated expression, respectively. Hexagons represent cellulose synthase or cellulose-synthase-like genes, with bright red and light gray indicating DEGs with up- or downregulated expression, respectively. Colored dots represent various osmotically active solutes. Black arrows qualitatively represent the amount of water flowing from cytoplasm into vacuole.

