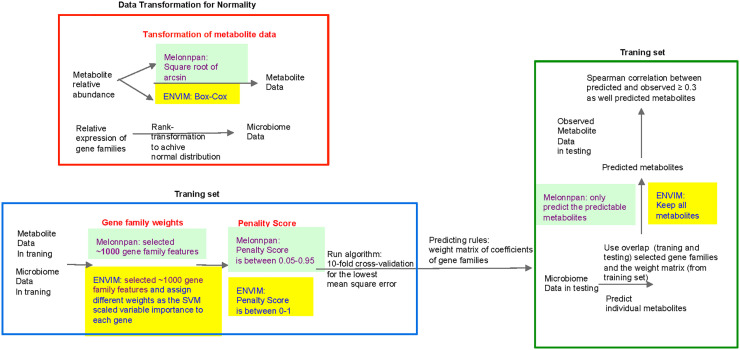
Figure 2.
Flowchart of MelonnPan and the elastic net variable importance model (ENVIM). The three differences between them include (red text) 1) transformation of metabolite data, 2) gene family weights, and 3) penalty score. The predictable metabolites are defined as the metabolites that have a significant Spearman correlation with the adjusted q-value (testing whether the correlation is zero) below the default threshold in the training set.

