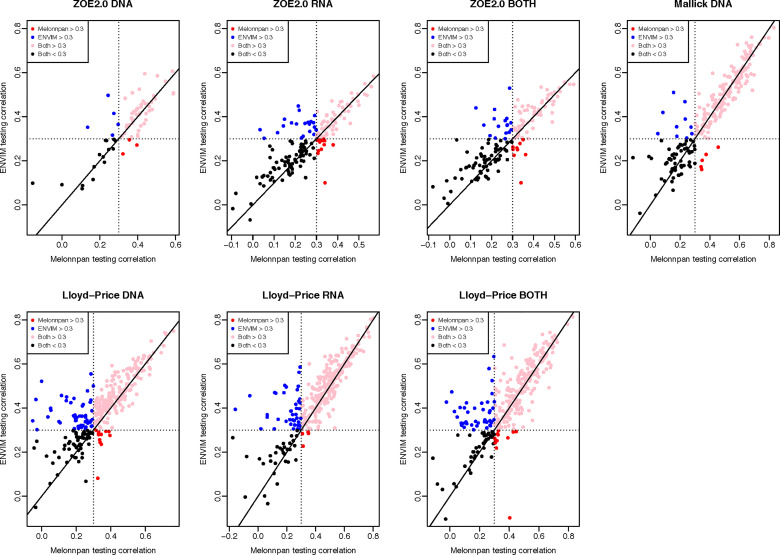
Figure 6.
For DNA, RNA, and both in each study and the testing set, this shows the scatter plot of Spearman correlation in ENVIM (y-axis) and MelonnPan (x-axis). Spearman correlation is based on observed metabolite abundance and predicted values. Here, “Both ≥0.3” refers to the category of metabolites that have Spearman correlation ≥0.3 in both ENVIM- and MelonnPan-predicted results. “ENVIM ≥0.3” refers to the category of metabolites that have Spearman correlation ≥0.3 only between ENVIM-predicted and observed values.

