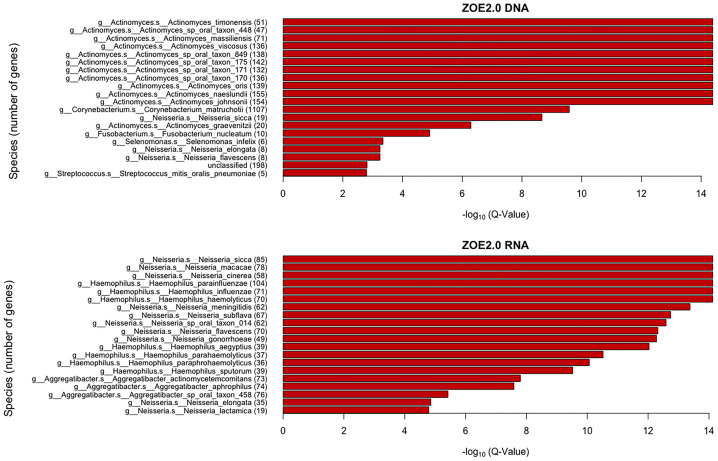
Figure 9.
Taxonomic enrichment of metabolite predictive species for the most contributing species to metabolite prediction, based on ZOE 2.0 DNA or RNA by ENVIM. The top 20 significant over-represented bacteria with the smallest Q-values (Q < 0.05) for ZOE 2.0 data. The Q-value is based on the Kolmogorov–Smirnov (KS) test p-values after FDR correction. Upper, DNA data; Lower, RNA data.

