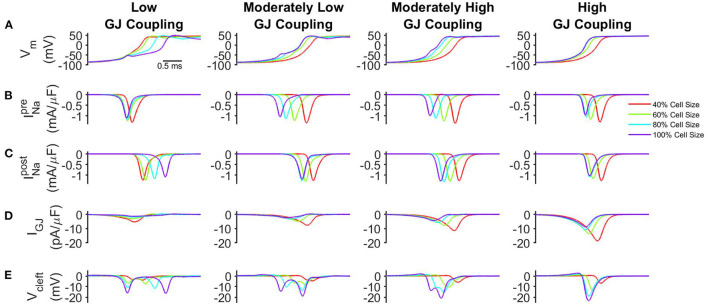
Figure 2.
Conduction velocity (CV) depends on cell size and GJ coupling. (A) Transmembrane voltage of the post-junctional node of the ID (Vm), (B) Na+current at the pre-junctional node of the ID (), (C) Na+current at the post-junctional node of the ID (), (D) GJ current at the ID (IGJ), and (E) cleft voltage (Vcleft) are shown in tissue for low (50.6 nS), moderately low (101 nS), moderately high (253 nS), and high (1,266 nS) GJ coupling. For clarity, traces are shown for the same spatial point of 1.2 mm from the pacing site. Parameters: IDNa= 50%, ρNa= 100%, w = 20nm.

