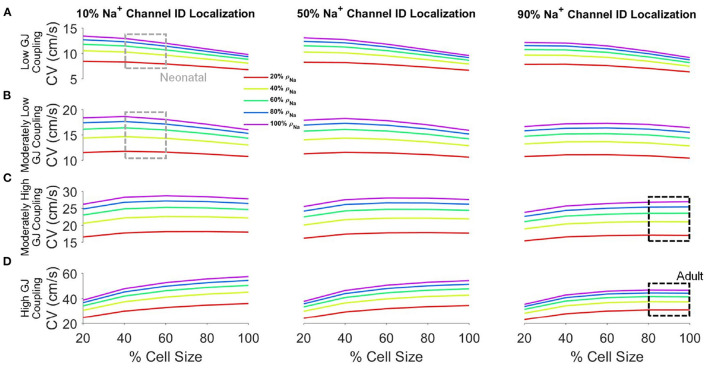
Figure 3.
Conduction velocity (CV) depends on key cellular and tissue properties. CV is shown as a function of cell size for different values of Na+channel densities (ρNa) for low (A), moderately low (B), moderately high (C), and high (D) GJ coupling and 10% (left), 50% (middle), and 90% (right) Na+channel ID localization (IDNa). Parameters: Cleft width w = 20nm. Parameter regimes associated with neonatal (gray boxes) and adult (black boxes) tissue are highlighted.

