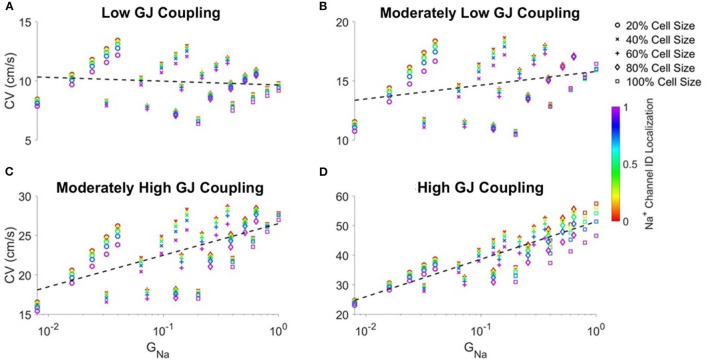
Figure 4.
Correlation between conduction velocity (CV) and total cell Na+conductance (GNa) increases as gap junctional coupling increases. Conduction velocity (CV) is shown as a function of GNa for different cell sizes and Na+ channel ID localization for (A) low, (B) moderately low, (C) moderately high, and (D) high GJ coupling. Pearson correlation coefficients r for low (r = −0.103), moderately low (r = 0.283), moderately high (r = 0.607), high (r = 0.865) GJ coupling. Parameters: Cleft width w = 20nm.

