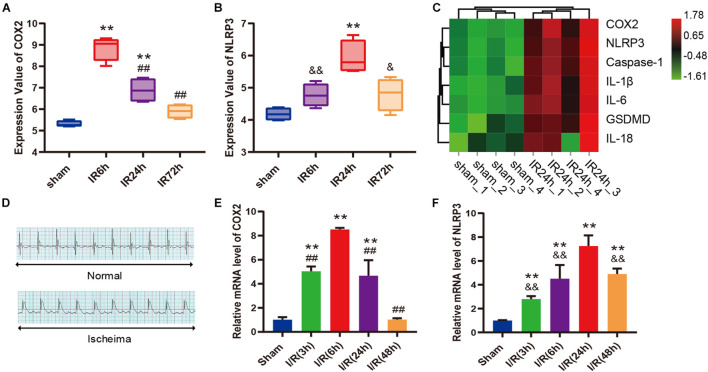
FIGURE 3.
COX2 and molecules associated with pyroptosis were both up-regulated after myocardial I/R. (A,B) Transcriptional expression values of COX2 and NLRP3 in sham samples and I/R samples of GSE160516 dataset. n = 4. (C) Expression heatmap of COX2, NLRP3, caspase-1, IL-1β, IL-6, GSDMD, and IL-18 in sham samples and IR24h samples. Each column represents a sample and each row represents expression profile of a specific gene. The color scale demonstrates the relative gene expression level in certain grid: green and red indicate the low and high expression values of the gene, respectively. (D) Representative electrocardiograph before and after ligation of LAD in vivo model of myocardial I/R. (E,F) Changes in mRNA expression levels of COX2 and NLRP3 after myocardial reperfusion. n = 5. Data are expressed as the mean ± SD; **p < 0.01 versus sham group or Sham group; ##p < 0.01 versus IR6h group or I/R(6h) group; &p < 0.05, &&p < 0.01 versus IR24h group or I/R(24h) group. I/R, ischemia/reperfusion; LAD, left anterior descending coronary artery.

