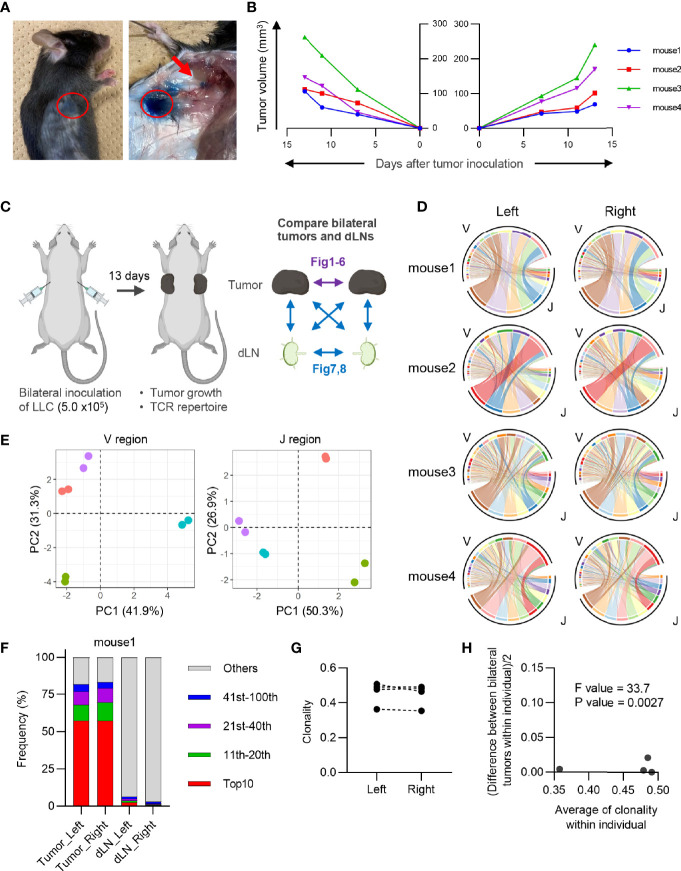
Figure 1.
Characteristics of CD8+ T cell repertoire in the bilateral tumor. (A), Visualization of draining lymph node (dLN) in our bilateral tumor model. 1% Evans Blue dye was injected into the tumor (red circle) 30 min prior to euthanasia. Brachial LN (arrow) was stained by Evans Blue, indicating this LN became a dLN. (B), Growth curve of the tumor inoculated bilaterally on the backs. Lines of the same color indicate left and right tumors of the same mouse (n = 4). (C), Experimental scheme for the entire study. Results of the comparison between bilateral tumors are presented in Figures 1 – 6 , and those between bilateral dLNs or dLN and tumor are presented in Figures 7 , 8 . (D), V/J segment usage plots of the bilateral CD8+ T cell repertoires. Ribbons connecting the V and J segments are scaled by the corresponding V/J pair frequency. The color of the circumference represents the same V and J genes, and the color of the ribbon represents the same J genes (n = 4). (E), Principal component analysis of V and J segment usage of tumor-infiltrating CD8+ T cells. Dots of the same color indicate left and right tumors of the same individual (n = 4). (F), Frequency of abundant CD8+ T cell clones in the tumor and dLN. CD8+ T cell clones were categorized into five classes based on their rank in each repertoire: top 10, 11th–20th, 21st–40th, 41st–100th, and others. The total frequency of clones in each class is shown (n = 4). (G), Clonality of the CD8+ T cell repertoire of the left and right tumor (n = 4). (H), Homoscedasticity plot for variance of clonality in individual mice. The X-axis represents the average clonality of bilateral tumors in each individual (n = 4). The Y-axis represents variance of clonality between different bilateral tumors within individuals. Sum of squares within mouse = 9.7 × 10⁻⁴; sum of squares between mice = 2.4 × 10⁻²; degree of freedom within mouse = 4; degree of freedom between mice = 3.

