Figure 7.
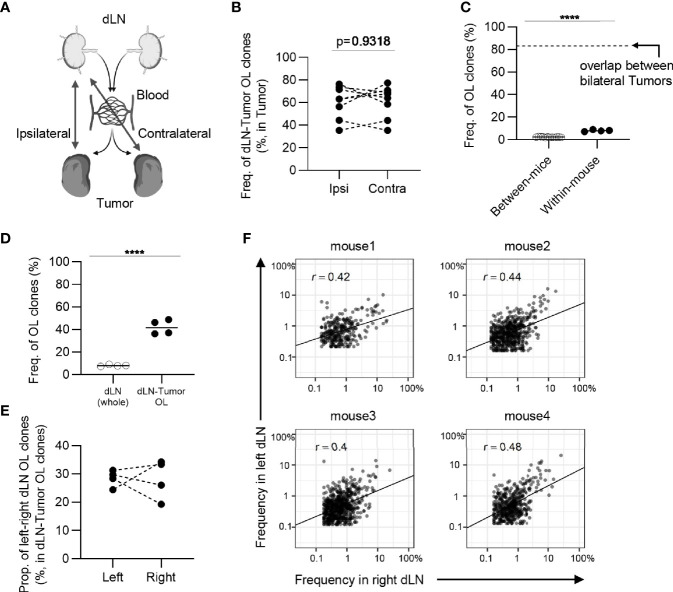
The similarity of CD8+ T cell repertoires in the bilateral dLNs. (A), Schematic diagram of the hypothesis that T cell clones induced in dLN infiltrate into tumors evenly through blood circulation. (B), The frequency of the clones overlapped between the dLN and its ipsilateral and contralateral tumor. Ipsi, ipsilateral; Contra, contralateral. n = 4 × 2. (C), Comparison of the frequency of overlapping clones in dLN between and within mice (between mice, n = 4 × 3; within mice, n = 4). The dotted line indicates the frequency of clones overlapped between bilateral tumors within the mouse. (D), Comparison of the frequency of left–right overlapping clones within whole dLNs and dLN-tumor overlapping repertoire (n = 4). (E), The proportion of left–right overlapping clones within the dLN-tumor OL repertoires (n = 4). (F), Scatter plot of left–right overlapping clones within the dLN-tumor OL repertoires (n = 4). Each dot represents a single clone with indicated frequency in each dLNs. Mean; Two-sided unpaired Student’s t-test; ns, non-significant. ****P ≤ 0.0001.

