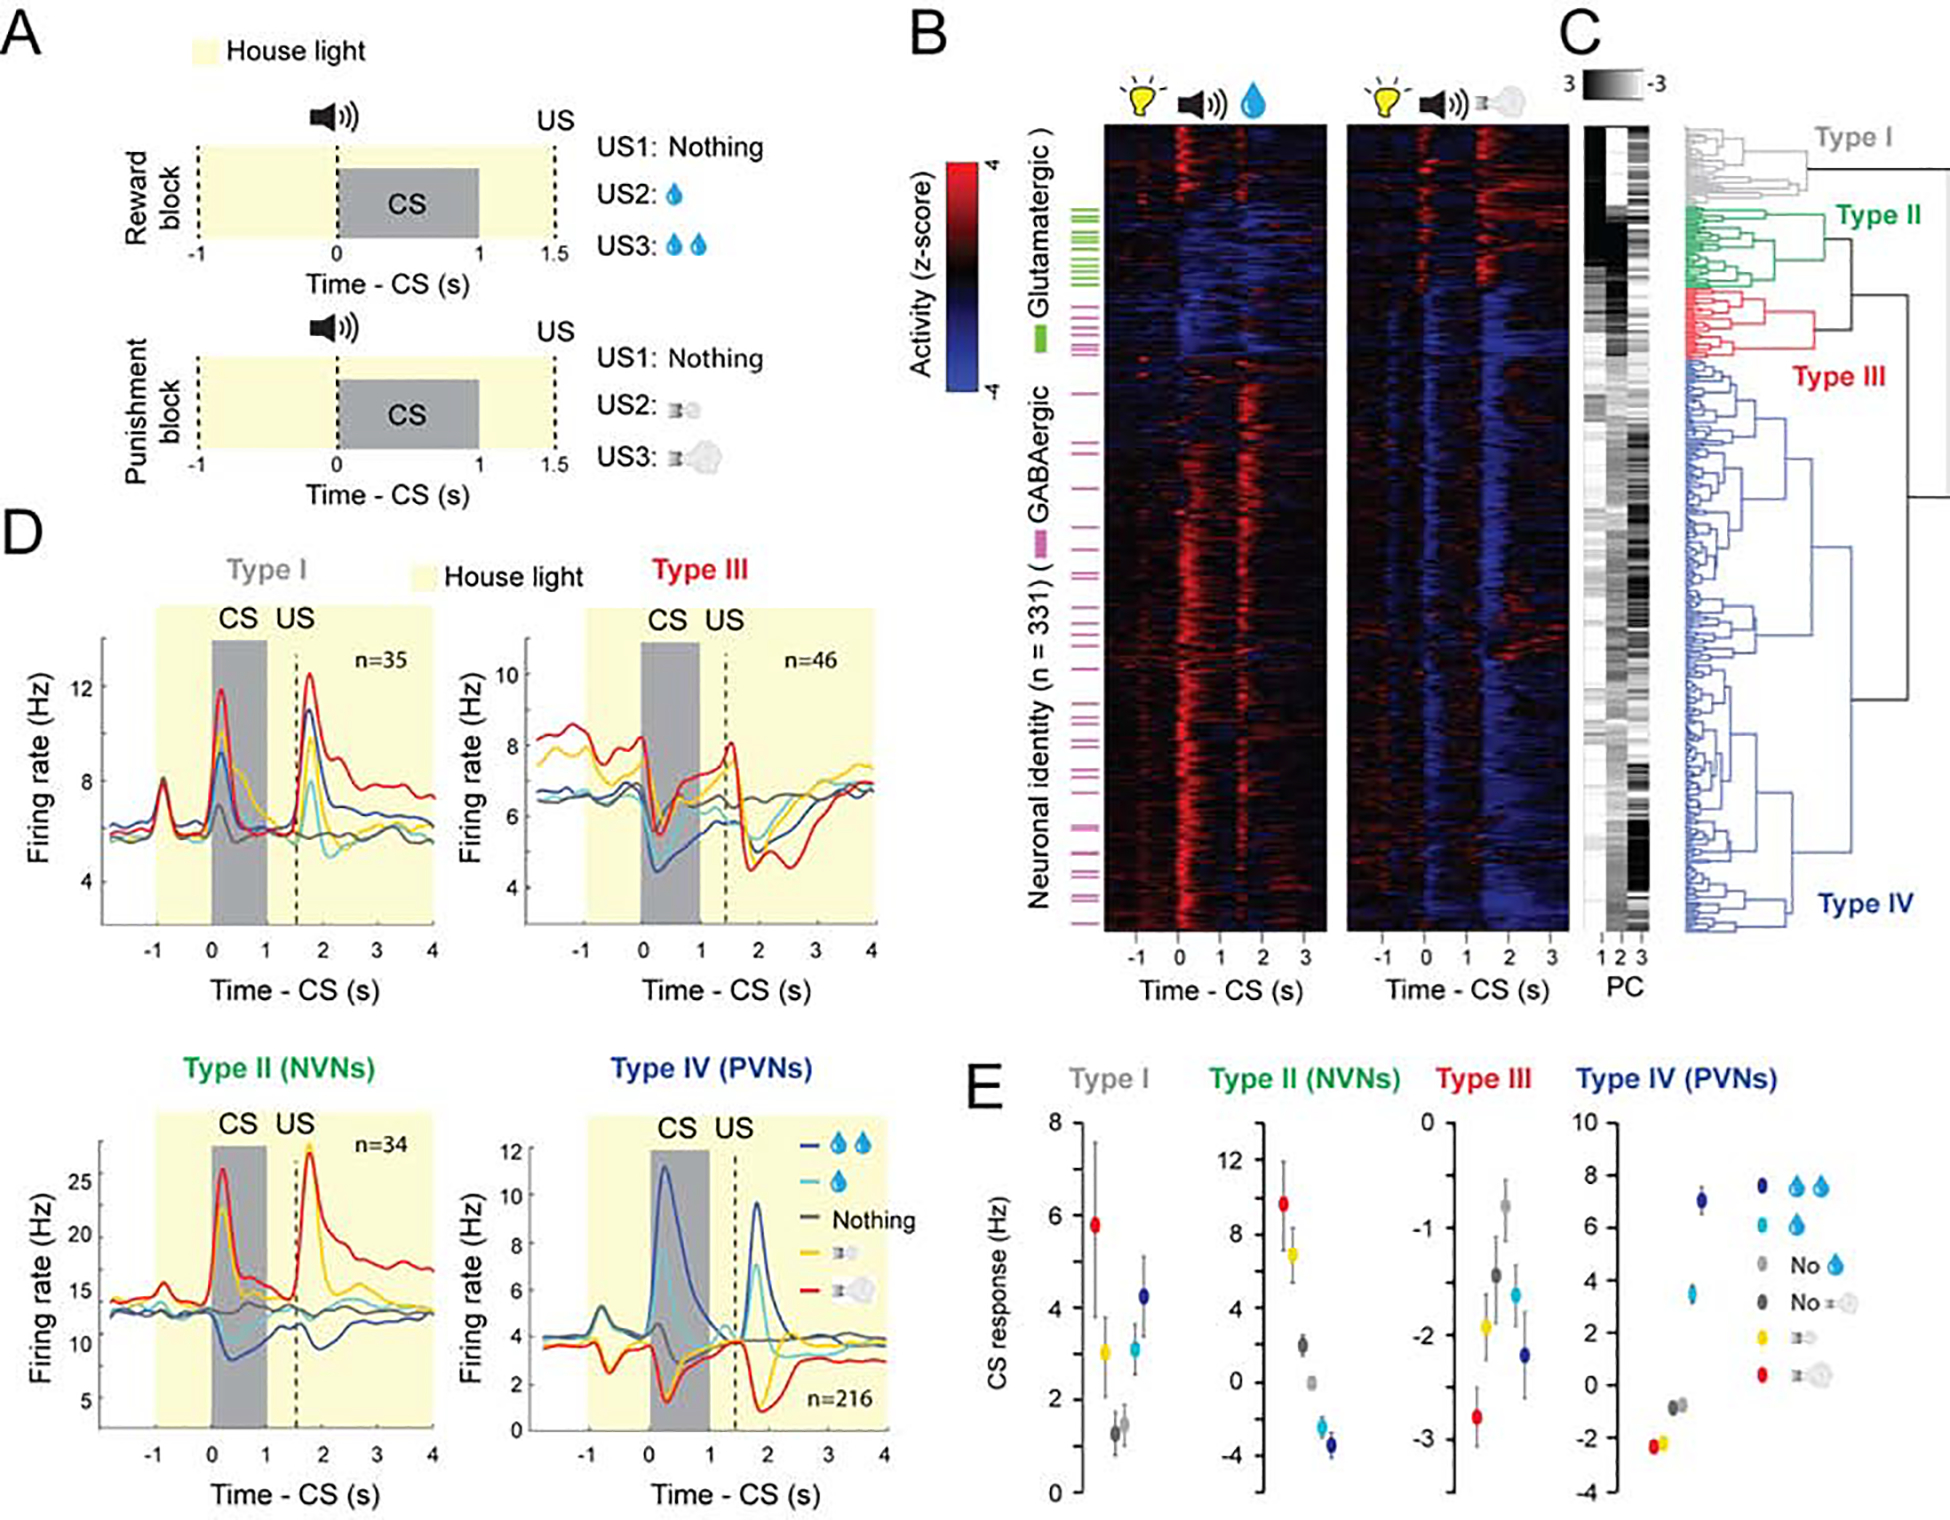
Figure 1. Separate VP populations opposingly encode motivational value and salience.

(A) Illustrations of experimental design of the reward and punishment classical conditioning tasks. The neutral CSs are the tones that predict nothing. (B) Z-score activity plots of the responses of all neurons recorded in the reward and punishment tasks. Red, increase from baseline; blue, decrease from baseline; each row represents one neuron. Green and purple dashes indicate neurons that were optogenetically tagged as being glutamatergic and GABAergic, respectively. (C) First three principle components (PC) and hierarchical clustering dendrogram showing the relationship of each neuron within the four clusters. (D) Average firing rates of the four types of neurons in the reward and punishment blocks, shown as spike density functions (n=331 from 6 mice). (E) Average CS response magnitude in the reward and punishment blocks for each of the four types of neurons. All comparisons between the average CS responses were significant (at least P<0.05; Wilcoxon signed-rank test) except between the two neutral CSs (which predict no reward and no punishment in the reward and punishment blocks, respectively, as indicated) in Type I, III and IV neurons. There was also no significant difference between the CS response predicting large and small punishments in Type III neurons. Data in D are presented as mean ± s.e.m.
