
Figure 2. Development of responses in VP neurons during learning.
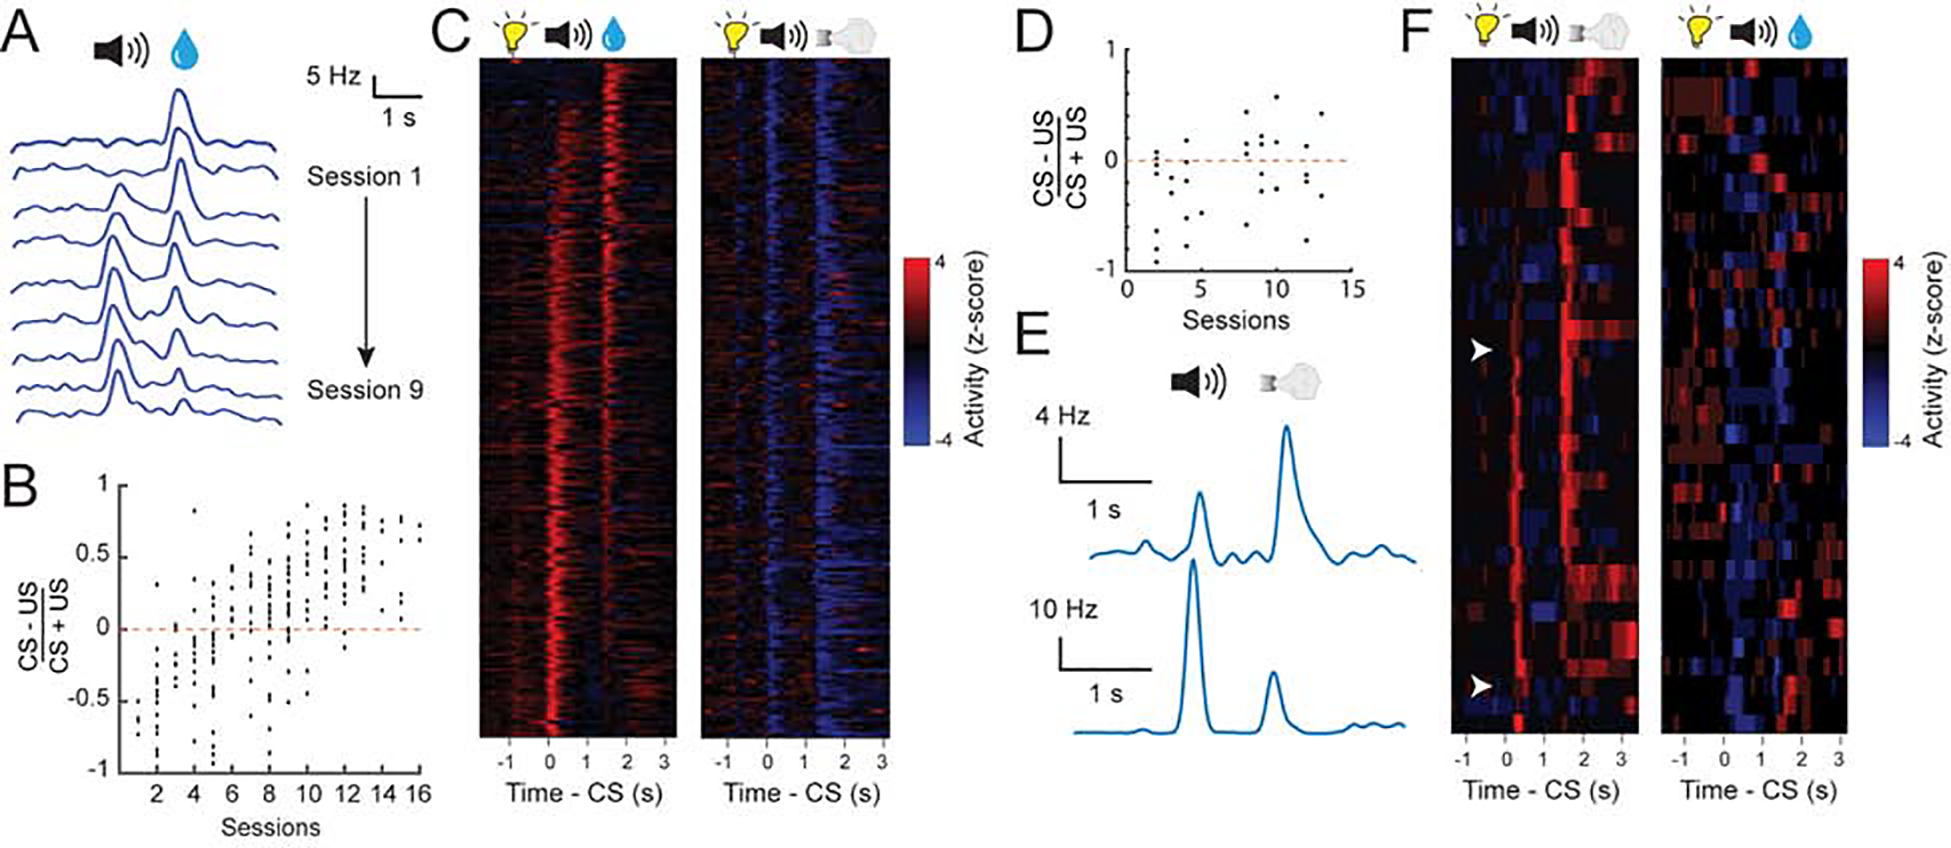
(A) The responses to reward cue (CS) or reward (US) in an example PVN tracked over multiple sessions (S1-S9). Responses are shown as spike density plots. (B) CS-US (reward) response index for all PVNs across different stages of training (r2 = 0.69, P < 0.001 by linear regression). (C) Z-score activity plots of the responses of all PVNs during reward and punishment blocks. Each row represents the activities of one neuron. Neurons are sorted according to their CS/US response ratio. (D) The CS-US response index for all NVNs in the punishment block across different stages of training (r2 = 0.41, P < 0.05 by linear regression). (E) The CS and US responses of two example NVNs in the punishment block at different stages of training. Responses are shown as spike density plots. (F) Z-score activity plots of the responses of all NVNs during reward and punishment blocks. Each row represents the activities of one neuron. Neurons are sorted according to their CS/US response ratio.