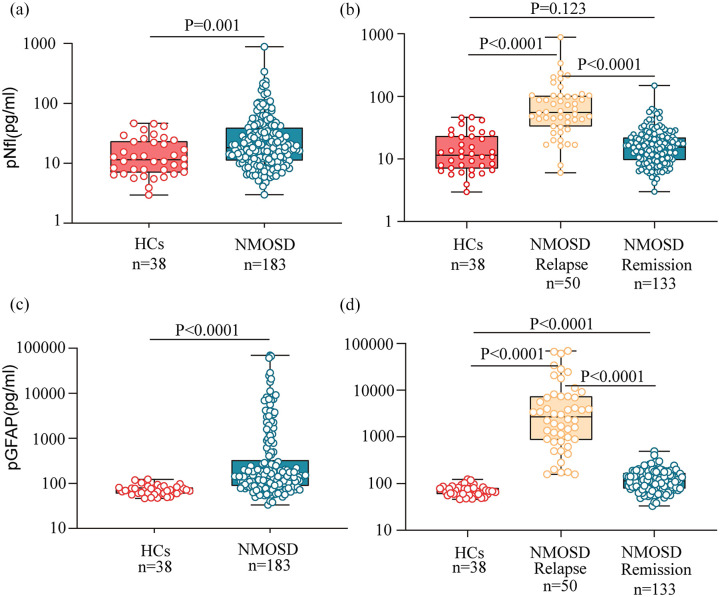
Figure 1.
pNfL and pGFAP levels in NMOSD and healthy controls. The box represents the median and the interquartile range with the original data, in panel a and b, plasma NfL levels and plasma GFAP levels were compared between patients with NMOSD and HCs, in panel c and d, NMOSD disease group were subdivided into relapse and remission states, and compared to HCs; p values were obtained from analysis of mixed effect model for log-NfL and log-GFAP, which were adjusted for age and sex; GFAP, glial fibrillary acidic protein; HCs, healthy controls; NfL, neurofilament light chain; NMOSD, neuromyelitis optica spectrum disorders.

