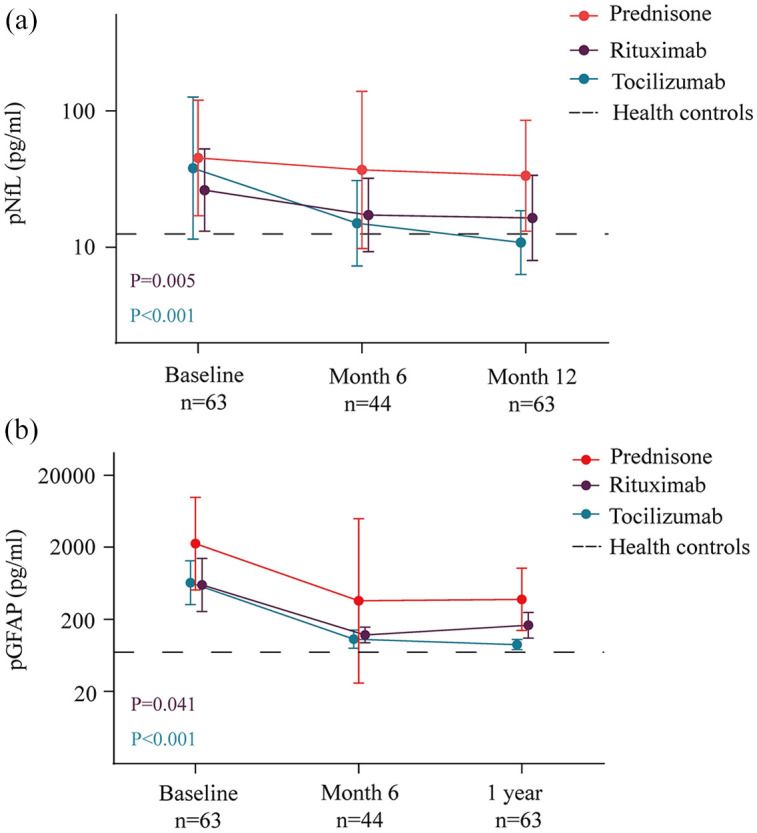
Figure 2.

Treatment effects on pNfL and pGFAP levels in follow-up. On treatment effects of tocilizumab and rituximab on pNfL and pGFAP levels were compared to Prednisone, the figures show the original, untransformed data with geometric means of NfL with 95% confidence intervals, p values were from mixed models for repeated measurements of log-NfL and log-GFAP. Dotted line represents plasma NfL (geometric means) concentrations in healthy controls; GFAP, glial fibrillary acidic protein; n, number of evaluable samples; NfL, neurofilament light chain.
