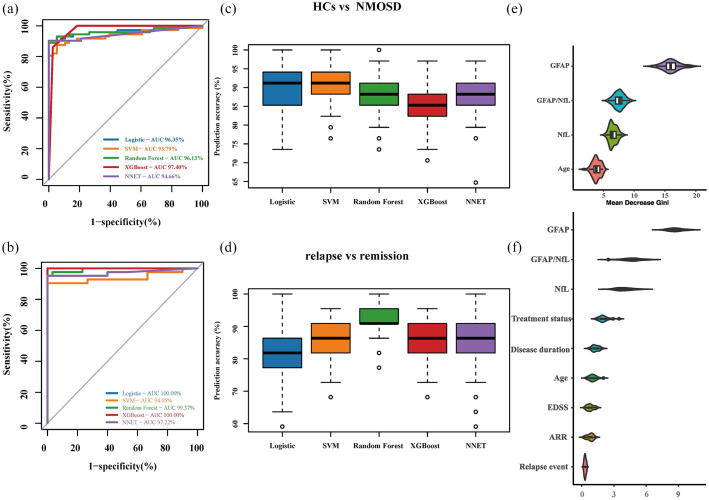
Figure 3.
Discriminatory ability of GFAP and NfL for disease state. ROC curves with AUC indicating the discriminatory ability of blood biomarkers and clinical variables as predictors to distinguish (a) between HCs and NMOSD and (b) between NMOSD relapse and remission stage via different machine learning algorithms. Distributions were generated from rerunning each model 100 times, containing 70% of the samples as the Training set, and 30% samples as the test set (randomly selected). The boxes (c and d) represent with the median and 25% and 75% percentiles, dots are values under and above the adjacent values outliers. In panel E and F, relative importance scores were defined as the mean decrease in Gini score obtained from random forest models. Higher relative importance score indicates a greater relative importance of the variable in predicting value HCs versus NMOSD, and NMOSD relapse versus remission stage. Violin plots represent ranking distributions generated by rerunning the model 50 times. AUC, area under the curve; HCs, healthy controls; ROC, receiver-operating characteristic.

