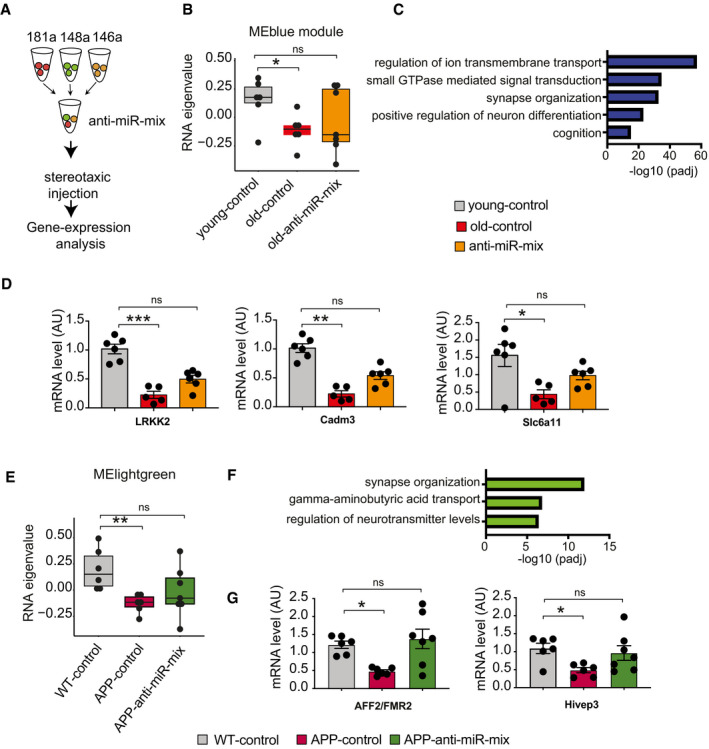
Figure 7. The 3‐microRNA signature is a target for RNA therapeutics to treat neuronal dysfunction.

- Experimental outline. Anti‐miR‐mix of the 3 microRNAs was injected into the dorsal hippocampus of the mice as previously described. RNA‐seq data were generated from dorsal hippocampal tissues and compared to those treated with control scrambled oligonucleotides.
- Weighted gene co‐expression analysis of hippocampal RNA‐seq data identified the MEblue gene cluster that is decreased when comparing 3‐month‐old mice (young‐control) to cognitively impaired 16.5‐month‐old mice (old‐control) with a scramble control oligonucleotide injected. Treating old mice with the miR‐inhibitor mix (old miR‐inhibitor mix) reinstated gene expression of this cluster, at least in part (n = 6–7, Kruskal–Wallis test).
- Gene ontology reveals that the MEblue cluster is linked to cognition and synapse organization.
- qPCR assay for several synaptic genes (LRKK2, Cadm3, and Slc6a11) confirms reinstatement of gene expression with anti‐miR‐mix (n = 5–7, Kruskal–Wallis test).
- Weighted gene co‐expression analysis of hippocampal RNA‐seq data identified a MElightgreen gene cluster that is decreased when comparing wild‐type control (WT control) to APPPS1‐21 mice (APP‐control) and was reinstated in APPPS1‐21 mice‐treated miR‐inhibitor mix (n = 6–7, Kruskal–Wallis test).
- Gene ontology reveals that the MElightgreen cluster is linked to cognition and synapse organization.
- qPCR data show rescue of AFF2/FMR2 and Hivep3 expression in APP/PS1 mice treated with inhibitor cocktail (n = 6–7, Kruskal–Wallis test).
Data information: *P < 0.05, **P < 0.01, ***P < 0.001. Bars and error bars indicate mean ± SEM. In boxplots (B, E), the centerline indicates the median, while the upper and lower lines represent the 75th and 25th percentiles, respectively. The whiskers represent the smallest and largest values in the 1.5× interquartile range.
