
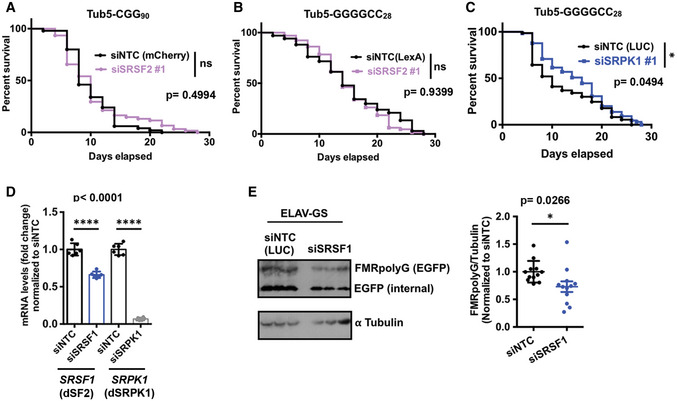
Figure EV3. Impact of SRSF and SRPK modulation on RAN translation and survival assays in Drosophila .
-
A–CSurvival assays of (CGG)90‐EGFP and (G4C2)28‐EGFP expressing fly under Tub5‐GS driver with respective siRNAs as mentioned. Log‐rank Mantel–Cox test; n = 50–61 (A), 65–67 (B); and 65–73 (C). *P < 0.05.
-
DDrosophila SRSF1 (dSF2, blue bar) and SRPK1 (gray) levels after siRNA knockdown as compared to non‐targeting siRNA (siNTC, black bars), quantified by qRT–PCR. Error bars represent mean ± SD RNAs from two (n = 2 biological repeats) independent fly crosses (20–25 flies/genotype per cross) used to run RT–qPCR in triplicates (3 technical replicates). All data points presented in the graphs.
-
EWestern blot of FMR‐polyG‐EGFP RAN products in (CGG)90‐EGFP/ELAV‐GS flies with or without SRSF1 knockdown. Error bars represent mean ± SD. Total protein from three (n = 3 biological repeats) independent fly crosses (20–22 flies/genotype per cross) and run in four replicates per gel (technical replicates). All data points presented in the graphs.
Data information: Statistical analysis in (D) and (E) is performed using Student’s t‐test with Welch’s correction. *P < 0.05, ****P < 0.0001.