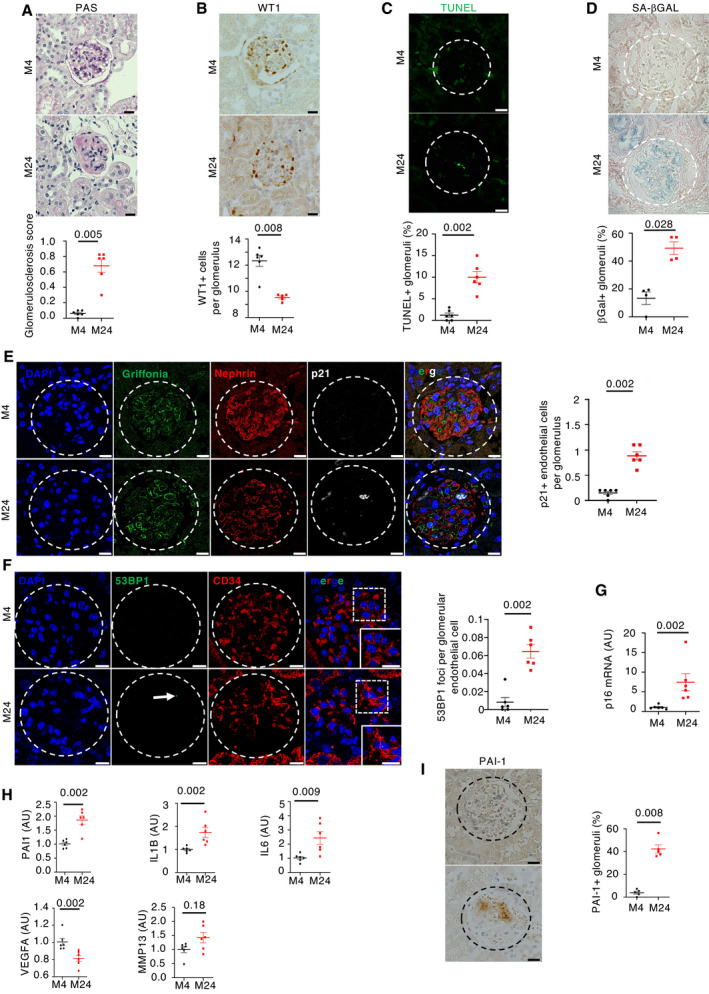
Figure 1. Physiological renal aging is characterized by glomerulosclerosis, podocyte loss, and glomerular endothelial senescence.

- Morphology (PAS staining, upper panels) and quantification of glomerular lesions (lower panel) of kidneys from young and aged mice. Original magnification ×400. Scale bar = 20 μm. n = 6 for young and old mice.
- WT1 immunohistochemistry (upper panels) and quantification of WT1‐positive glomerular cells (lower panel) in kidneys from young and aged mice. Original magnification ×400. Scale bar = 20 μm. n = 6 for young and old mice.
- TUNEL assay (upper panels) and quantification of TUNEL‐positive tubular cells (upper panel) in glomeruli from young and aged mice. Panels are representative images of 6 young and old mice. Scale bar = 20 μm.
- Senescence‐associated β‐galactosidase staining (upper panels) and quantification of β‐galactosidase‐positive glomeruli (lower panel) in kidneys from young and aged mice. Original magnification ×400. Scale bar = 20 μm. Panels are representative images of four young and old mice.
- p21/griffonia simplicifolia/nephrin coimmunostaining in kidneys from young and aged mice (left panels) and quantification (right panel) of p21‐positive endothelial cells per glomeruli. Original magnification ×630. Scale bar = 10 μm. Panels are representative images of 6 young and old mice.
- 53BP1/CD34 coimmunostaining in kidneys from young and aged mice (left panels) and quantification (right panels) of 53BP1 foci per glomerular endothelial cell. Original magnification ×630. Scale bar = 10 μm. Panels are representative images of 6 young and old mice.
- p16 mRNA expression in whole kidney from young and old mice. n = 6 for young and old mice.
- mRNA expression of SASP components in kidneys from young and aged mice. n = 6 for young and old mice.
- PAI‐1 immunohistochemistry (left panels) and quantification of PAI‐1‐positive glomeruli (right panel) in kidneys from young and aged mice. Original magnification ×400. Scale bar = 20 μm. n = 5 for young and old mice.
Data information: Data are means ± SEM. Statistical analysis: Student's t‐test: young vs old mice.
