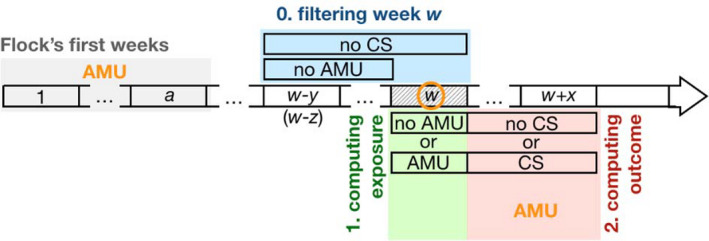
FIGURE 1.

Data preparation for the estimation of the prophylactic effect of AMU. The horizontal arrow represents the time line of a flock, divided into weeks, represented by rectangles, starting on week 1 (on the left). For any given week w selected (by step 0, see below) for the analysis (represented here by the hashed rectangle), we computed (i) an exposure variable based on the use or not of antimicrobials (step 1, in green) and (ii) an outcome variable based on the occurrence or not of clinical signs over an observation period of x weeks after week w (step 2, in red). Statistical analyses then tested whether AMU on week w (exposure) affects the occurrence of clinical signs over the observation period (outcome). In order to make sure that AMU exposure on week w does correspond to prophylactic AMU, we filtered out all the weeks that were preceded by (i) the presence of clinical signs over a period of y weeks before week w (including week w) or (ii) AMU over a period of z weeks before week w (naturally excluding the candidate week, since this information is used to compute the exposure variable). This step 0 is shown in blue on the figure. Finally, the analysis includes potential confounding factors (shown in orange letters and circle) such as the age of the chicken (i.e. week w) as well as AMU during the first a weeks of the flock's life (brooding period, in grey) and during the x weeks of the observation period
