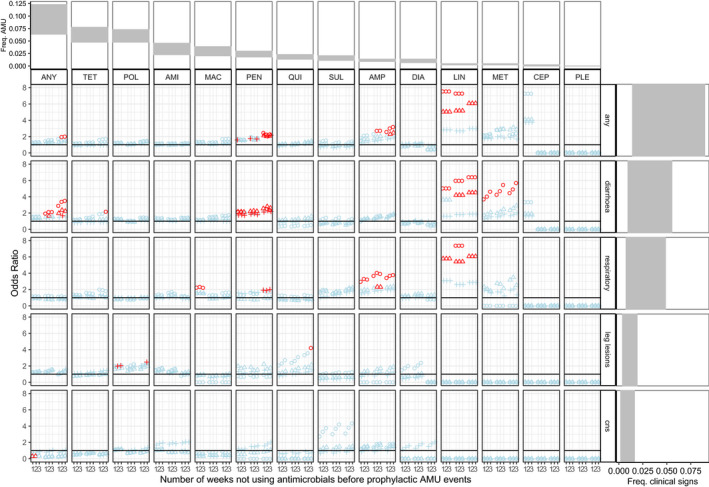
FIGURE 4.

OR (Odds Ratios) of occurrence of clinical signs when antimicrobials were used prophylactically. For the ease of visualization, confidence intervals are not represented. Instead, red colour indicates OR values that are statistically significant (p < .05) and light blue colour indicates OR values that are not significant. Circle, triangle and cross shapes represent durations x of the observation period equal to 1, 2 and 3 weeks, respectively. Numbers 1, 2 and 3 represent the duration y = z of the filtering period (the number of weeks without any AMU before prophylactic events). In each subpanel, each combination of three numbers 123 represented, from left to right, the AMU in the first 1, 2 and 3 weeks of life. The horizontal black line represents an OR value of 1. OR values higher than the horizontal black line indicate that the prophylactic AMU increases the risk of having clinical signs. A linear scale instead of a logarithm one was chosen for the OR in order to show the spread of significant values better. Antimicrobial classes were ordered from the most to the least commonly used. Abbreviations: ‘ANY’ = any classes, ‘AMI’ = aminoglycosides, ‘AMP’ = amphenicols, ‘CEP’ = cephalosporins, ‘DIA’ = diaminopyrimidines, ‘MAC’ = macrolides, ‘MET’ = methenamines, ‘LIN’ = lincosamides, ‘PLE’ = pleuromutilins, ‘POL’ = polypeptides, ‘QUI’ = quinolones, ‘SUL’ = sulphonamides, ‘TET’ = tetracyclines, ‘Freq. AMU’ = Frequency AMU, ‘Freq. clinical signs’ = Frequency clinical signs. First row and right column, respectively, show the ranges of frequencies of AMU and clinical signs observed in the study farms
