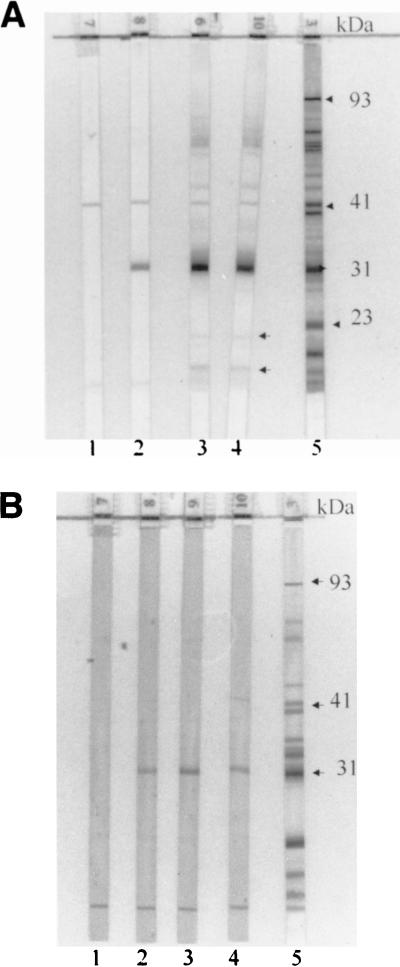
FIG. 2.
IgG (A) and IgM (B) immunoblot series of serum samples obtained from a vaccinated individual participating in the phase 2 trial at different times postvaccination. Strip numbers are located at the bottom of each strip. Results with pre (strips 1), day 30 (strips 2), day 90 (strips 3), and day 180 (strips 4) samples are shown. Positive controls are shown in strips 5, with arrows indicating a few relevant bands. Those specimens showing the most intense reactivity to OspA in IgG blots (strips 3 and 4) also show reactivity to two other bands below 23 kDa (OspC) (arrows positioned next to strip 4) and diffuse darkening in the upper region of the blot. IgM reactivity to OspA was less intense than IgG reactivity.

