
Figure 1. Increased STARD1 expressed in human NASH-driven HCC.
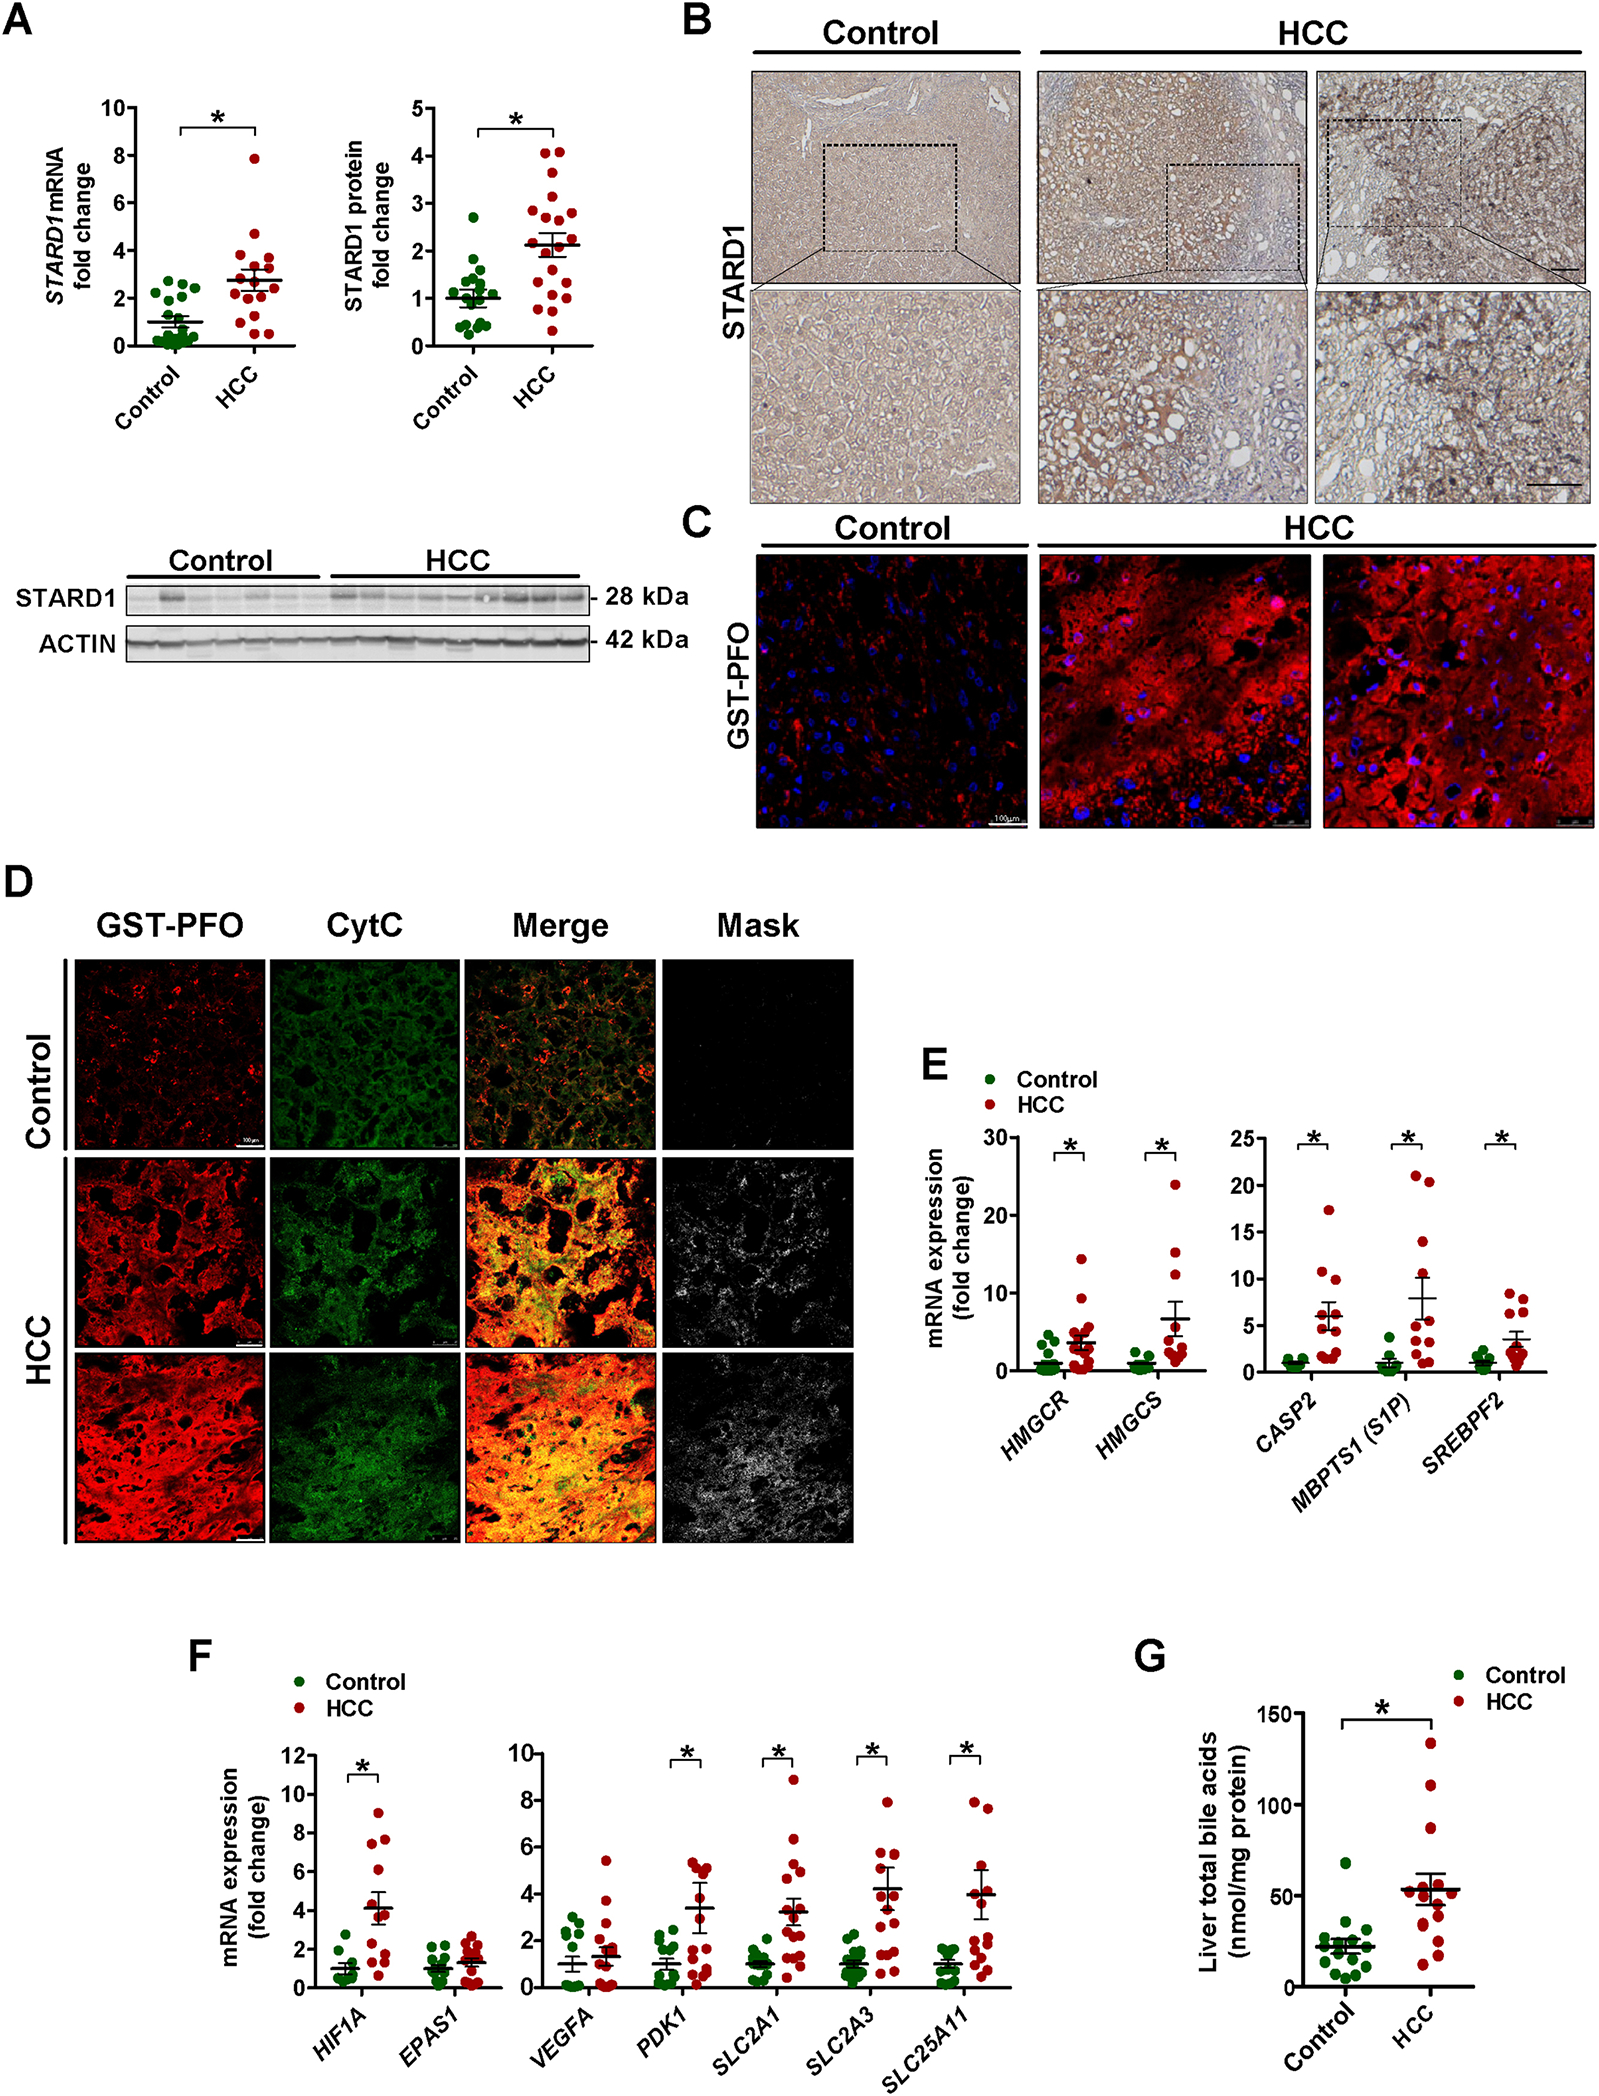
A) Expression of STAR gene mRNA by qPCR and STARD1 protein in liver tissue from control donors and NASH-driven HCC (N of controls =15, N of HCC patients 15–20).
B) Representative immunohistochemical expression of STARD1 from control and NASH-HCC patient liver samples.
C) Staining of liver sections from control and HCC samples with GST-PFO (red) to detect free cholesterol. Nuclei were stained with DAPI.
D) Immunostaining of liver sections from control and HCC samples with GST-PFO and cytochrome c (Cyt C), showing their colocalization as merge and mask. Bar 75 μm.
E) Transcript quantification by qPCR of genes controlling cholesterol biosynthesis, ER stress-driven activation of SREBP2.
F) mRNA levels of HIF1A and HIF2A (EPAS1) and HIF-1α regulated genes. N of control 13–18, N of HC 13–20.
G) Hepatic levels of total BAs in samples from control and human HCC. (N=15 both groups).
All values are mean ± SEM. * indicate statistically significant differences between the indicated groups (p<0.05) in Student’s t test. Magnification bar in histology pictures, 100 μm.