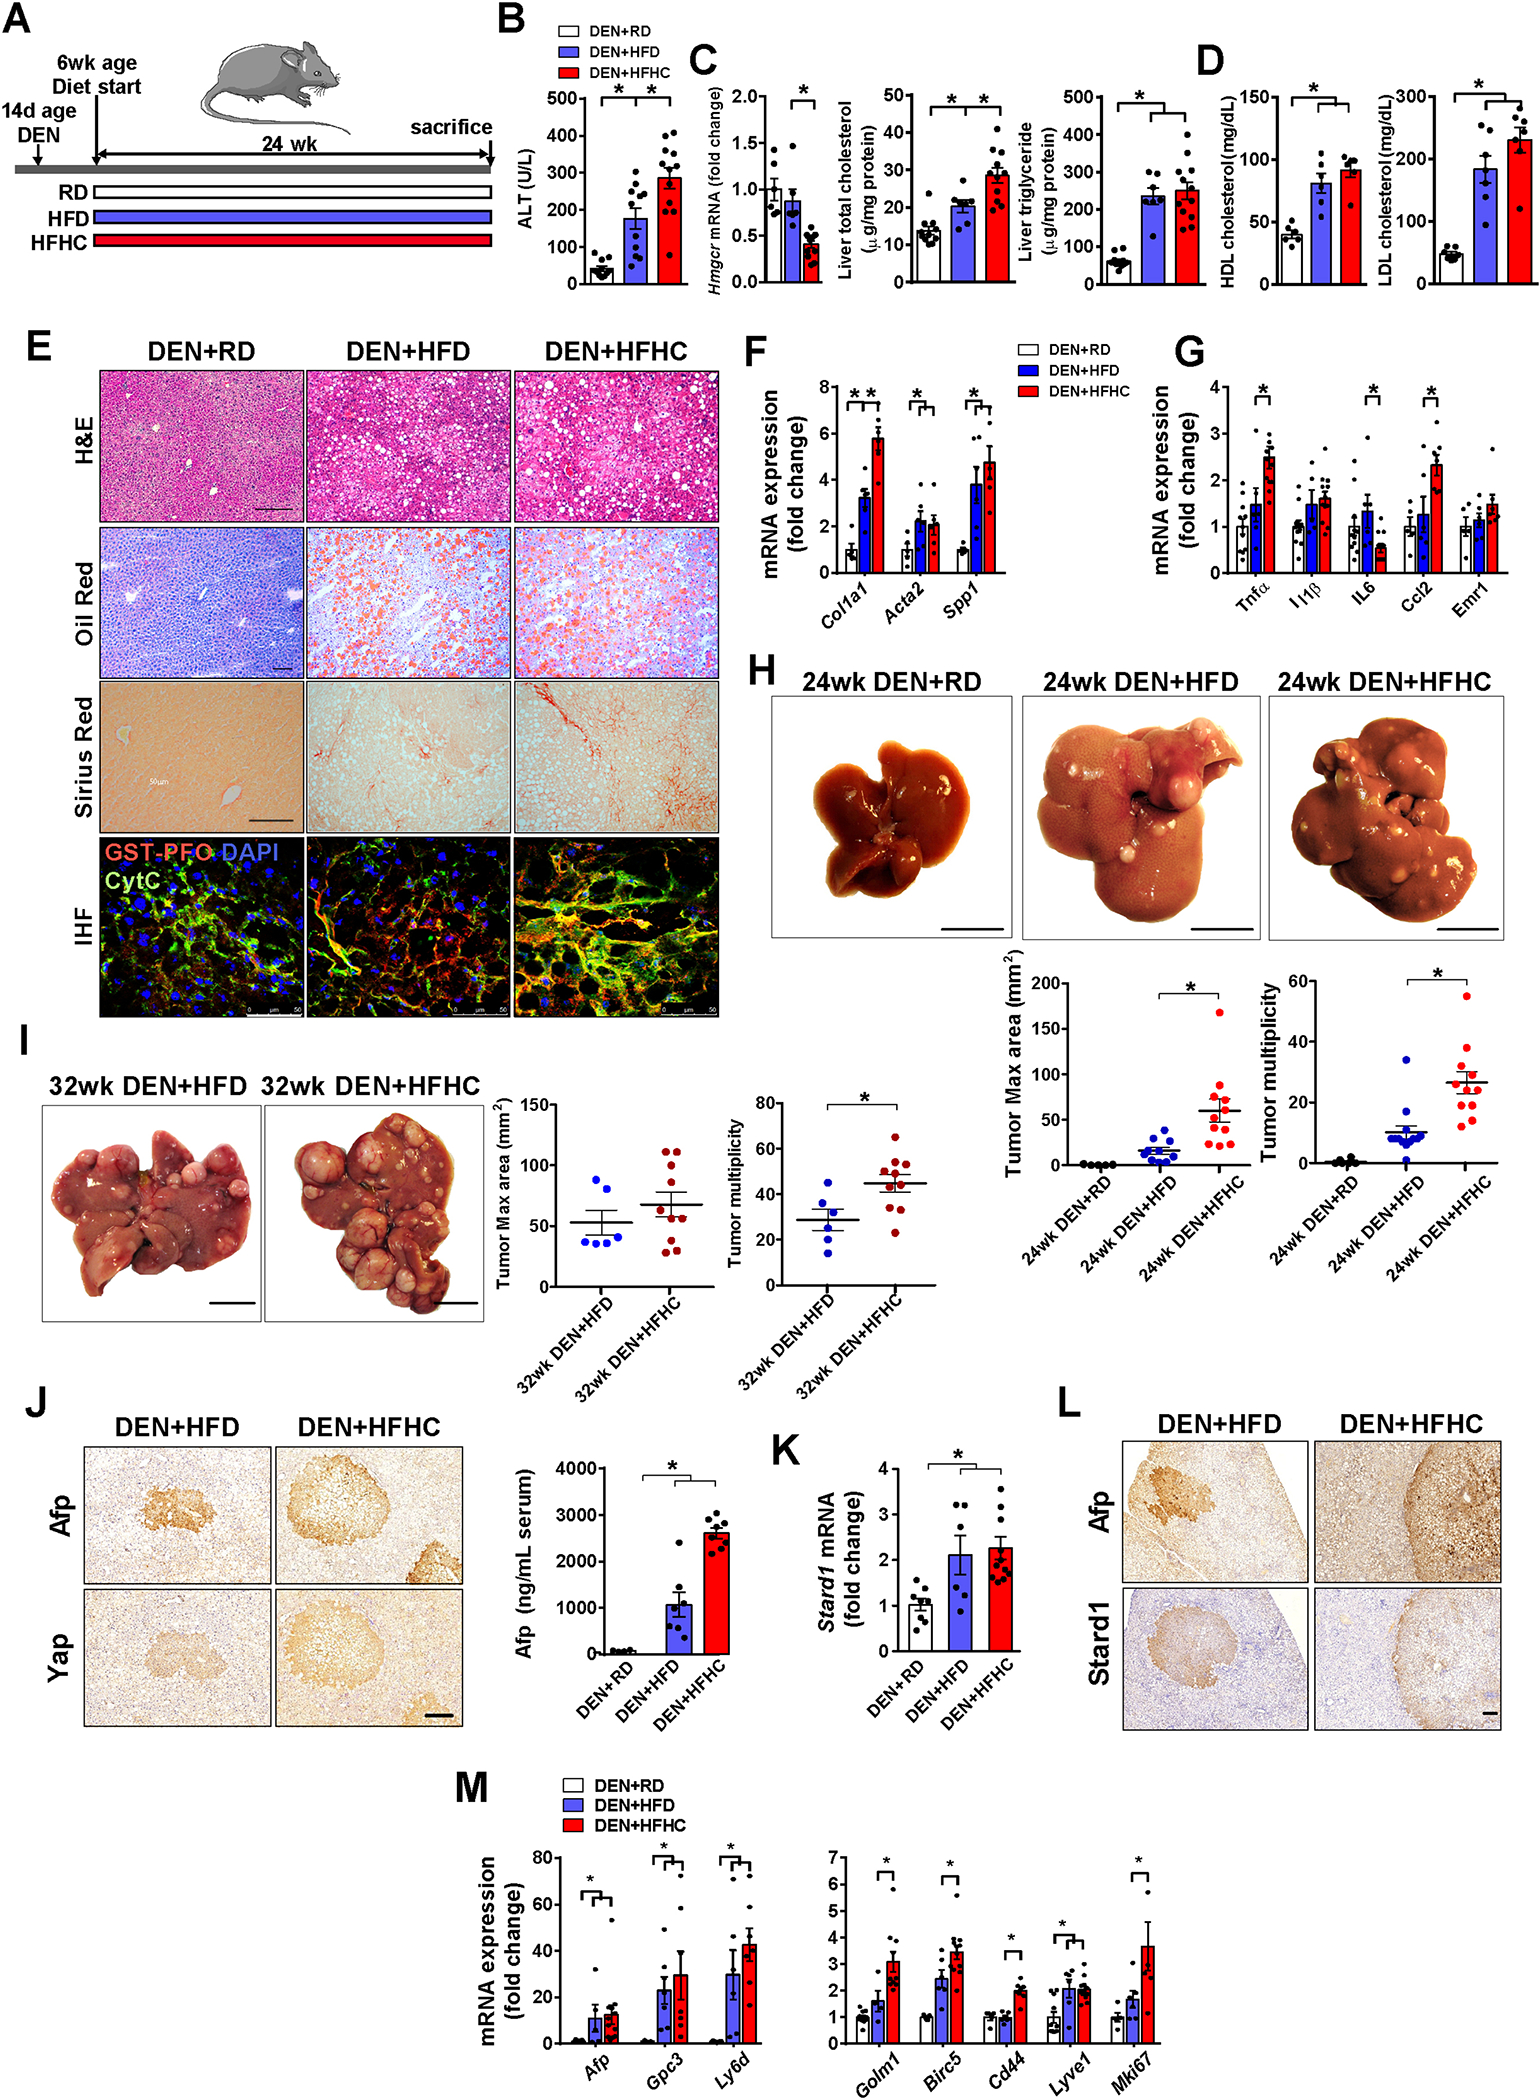
Figure 2. HFHC feeding promotes NASH-driven HCC development in DEN-treated wild type.

A) Schematic illustration of the experimental design, with induction of tumorogenesis in liver of mice with DEN at 14 days of age, feeding with regular diet (RD), high fat diet (HFD) or cholesterol-supplemented HFD (HFHC) diet for 24 weeks. N per group: RD (11), HFD (12), HFHC (12).
B) Transaminase serum levels (ALT) of mice after the corresponding treatments.
C) Liver Hmgcr transcript, total cholesterol and triglycerides liver composition. N=6 per group.
D) HDL and LDL levels in serum from DEN+HFD or DEN+HFHC fed mice. N=6 per group.
E) Representative histological staining for hematoxylin-eosin (H&E), neutral lipid (oil red o) and collagen fibers (sirius red) of liver sections. Immunohistofluorescence of liver sections stained for free cholesterol with GST-PFO probe (red), mitochondria with anti-cytochrome c (green) and nuclei with Dapi (blue). Size bar 100 μm.
F) mRNA levels of fibrogenesis-associated genes (Col1a1, Acta2, Spp1). All values are corrected by a housekeeping gene (Actb) and relative to values from the animals of DEN- RD diet. N=6–10 per group.
G) mRNA levels of inflammation genes (Tnfa, Il1b, Il6, Ccl2, Emr1).
H) Representative macroscopic images and quantification of tumor multiplicity and maximal area from DEN-treated mice fed HFHC diet for 24 weeks. RD, N=6; HFD, N=10; HFHC, N=11.
I) As in H) except that DEN-treated mice were fed HFHC diet for 32 weeks. HFD, N=6; HFHC, N=10.
J) Immunohistochemical expression of Afp and Yap of liver consecutive sections from DEN-treated mice fed HFC or HFHC diet for 24 weeks.
K) mRNA levels of Stard1 of whole liver tissue from DEN-treated mice fed RD or HFHC diet. N=6–10 per group.
L) Immunohistochemistry of consecutive sections (T, tumor) stained for Afp, or Star. Size bar, 500 μmeter.
M) mRNA levels of tumor markers and inflammatory genes of whole liver tissue from DEN-treated mice fed RD, HFD or HFHC. N=6–10 per group.
All values are mean ± SEM; symbol * indicates statistically significant differences (p<0.05) on a one-way ANOVA test or student’s t test.
