
Figure 5. Stard1 overexpression increases DEN+HFHC-driven HCC.
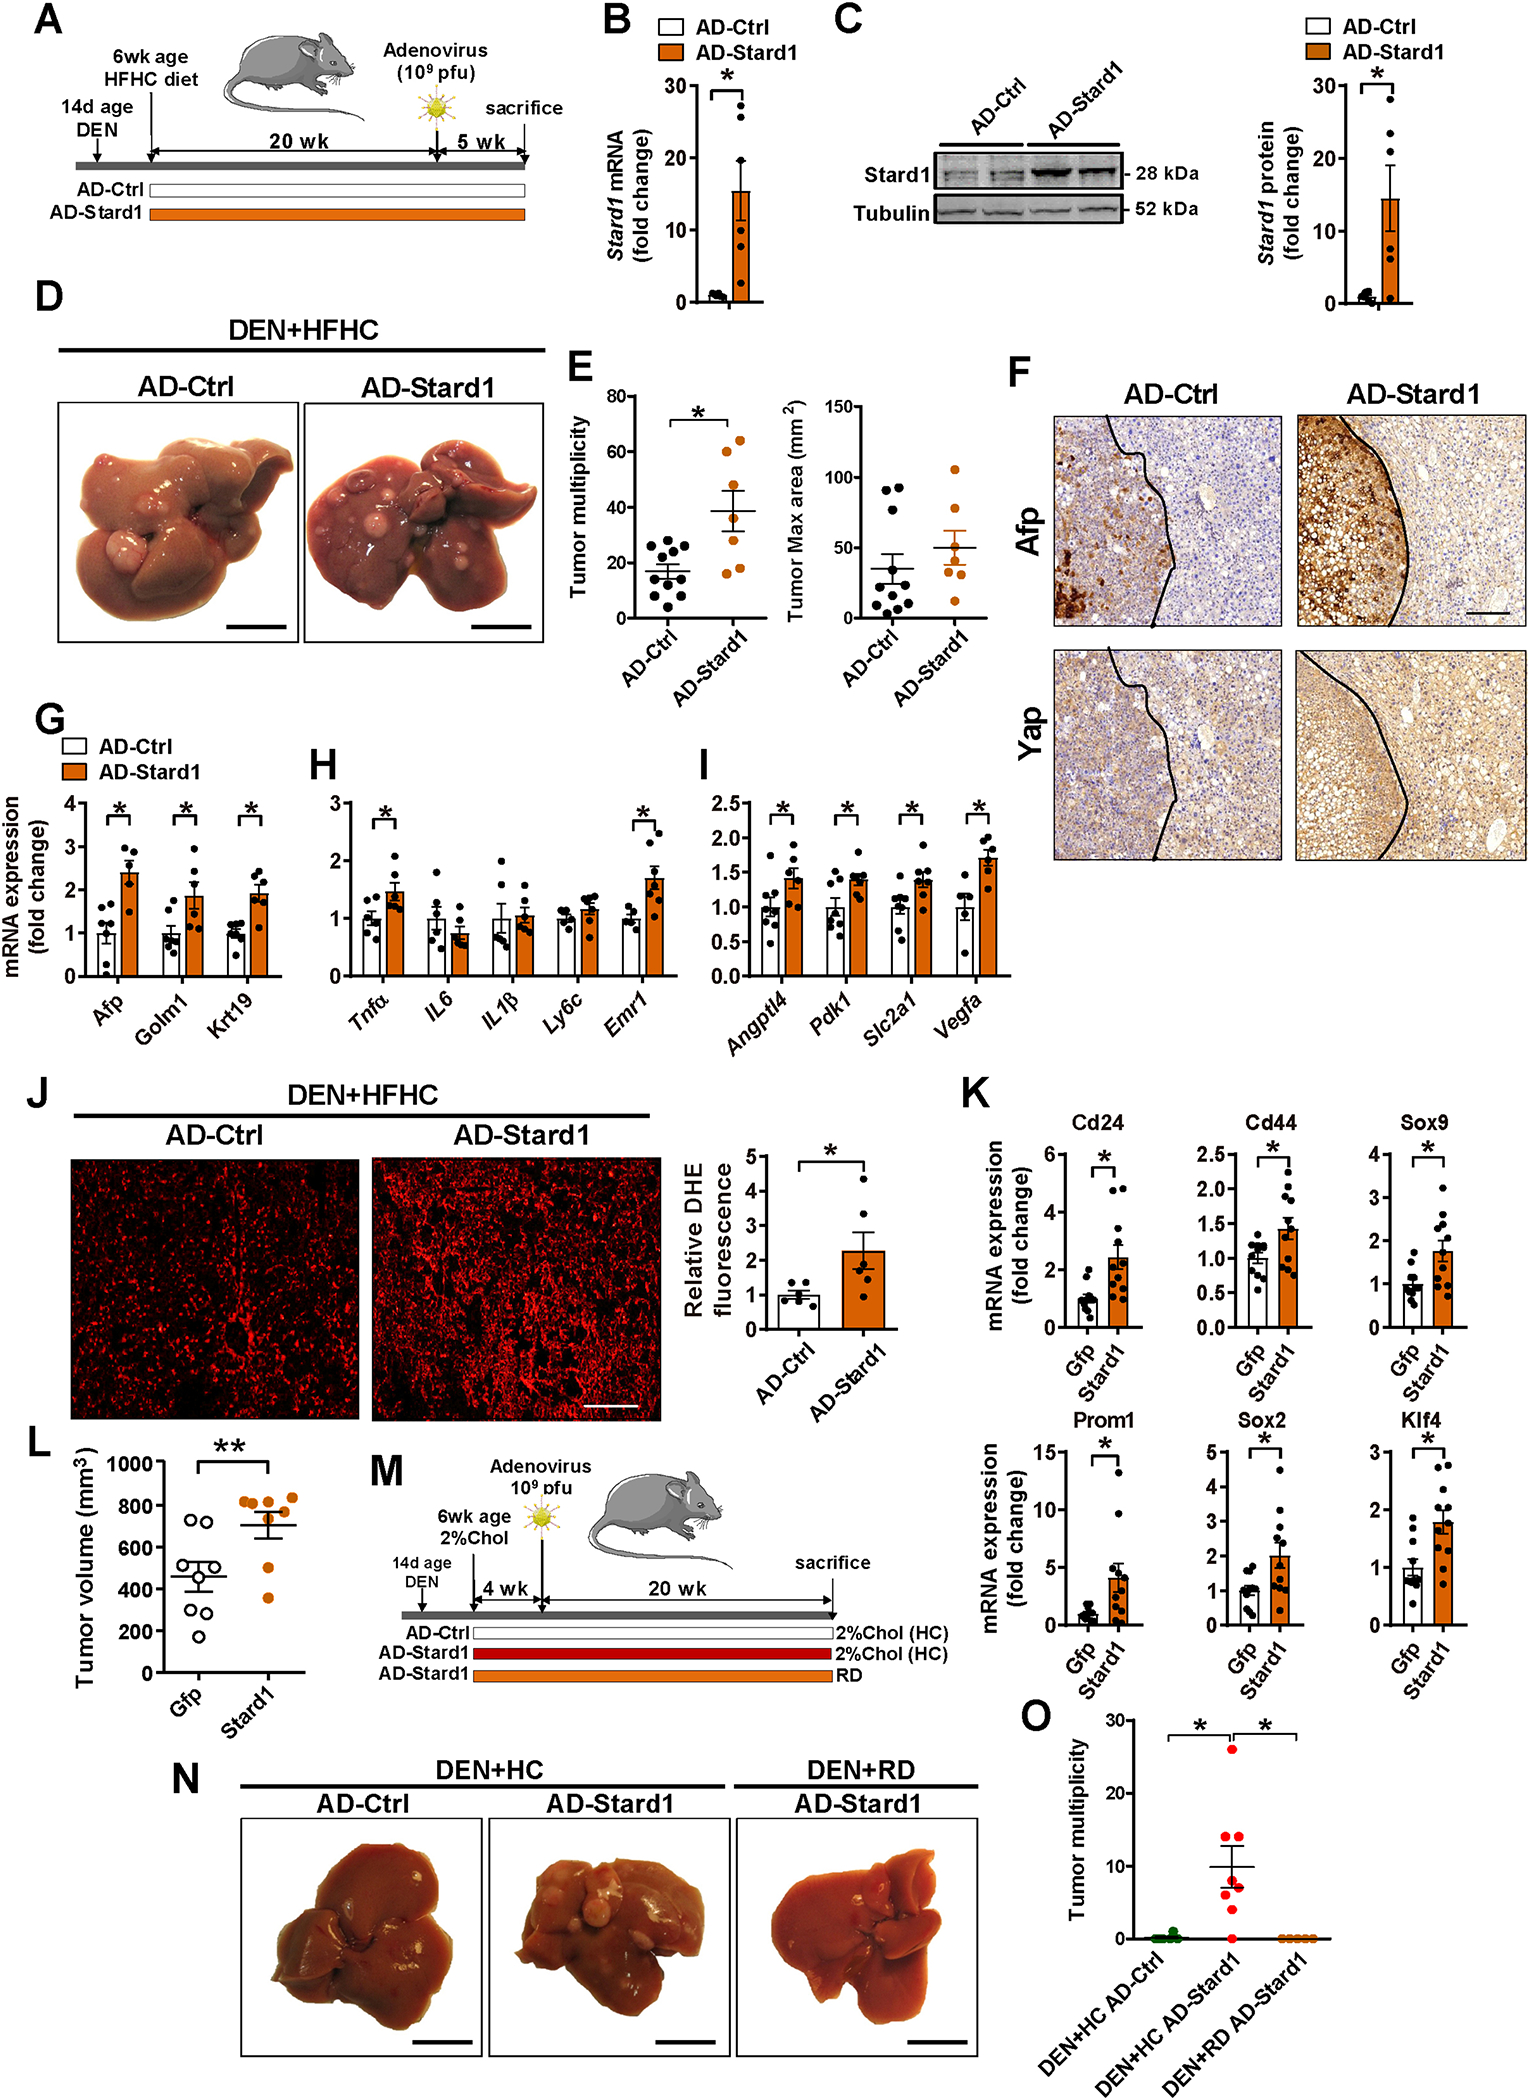
A) Schematic illustration of the experimental design used to overexpress Stard1 in wild type mice 5 months after DEN+HFHC treatment.
B) Adenoviral-induced overexpression of mouse Stard1 in liver of mice determined by qPCR. N=6 for each group.
C) Quantification of Stard1 overexpression by immunoblot densitometry and representative image of a Western blot for Stard1. N=6 for each group.
D-E) Representative images of livers and quantification of macroscopic liver tumor multiplicity and maximum size in animals after 5 weeks of recombinant adenovirus injection. N=11 for AD-Ctrl and N=7 for AD-Stard1.
F) Immunohistochemistry of consecutive sections showing the same tumor (T, delimited with a dotted line) and parenchyma stained for Afp, or Yap. Size bar 500 μmeter.
G, H, I) qPCR quantification of mRNA of HCC markers, fibrogenesis, inflammation and Hif1a target genes. N=6 per group.
J) ROS production measured and quantified in cryosections of liver tissue stained with DHE, (N=6).
K) mRNA levels of stemness genes measured in subcutaneous tumors induced by TICs with or without Stard1 overexpression. Values are mean ± SEM relative to the Gfp-expressing tumors (N=12). * denotes statistically significance in paired Student’s t test respect the matched Gfp-expressing tumors.
L) Subcutaneous tumor volume in nude mice induced by TICs transfected with control Gfp or Stard1. Values are mean ± SEM relative to the Gfp-expressing tumors (N=8). * denotes statistically significance in paired Student’s t test respect the matched Gfp-expressing tumors.
M) Schematic experimental design for adenoviral-mediated Stard1 overexpression (AD-Star) in DEN-treated wild type mice followed by feeding a regular diet (RD) (N=5) or a diet enriched in cholesterol (2%, HC) (N=8) or AD-Ctrl on HC diet (N=6).
N, O) Macroscopic images of livers from DEN-treated mice and quantification of tumor multiplicity.
All values are mean ± SEM. *p<0.05 denote statistically significant differences respect to Ad-Ctrl in a student’s t test.