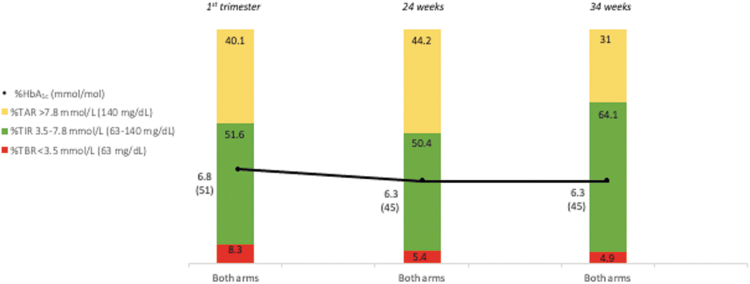
FIG. 1.
CGM-based TIR and HbA1c in pregnant women included in the subanalysis. The diagram displays average TIR, TAR, TBR, and HbA1c in each trimester for RT-CGM and control arms combined. P-values for change over time were P < 0.001 for TAR, P < 0.001 for TIR, P < 0.001 for TBR, and P < 0.001 for HbA1c. CGM, continuous glucose monitoring; HbA1c, glycated hemoglobin; RT-CGM, real-time CGM; TAR, Time-above-range; TBR, Time-below-range; TIR, Time-in-range. Color graphics appear online.

