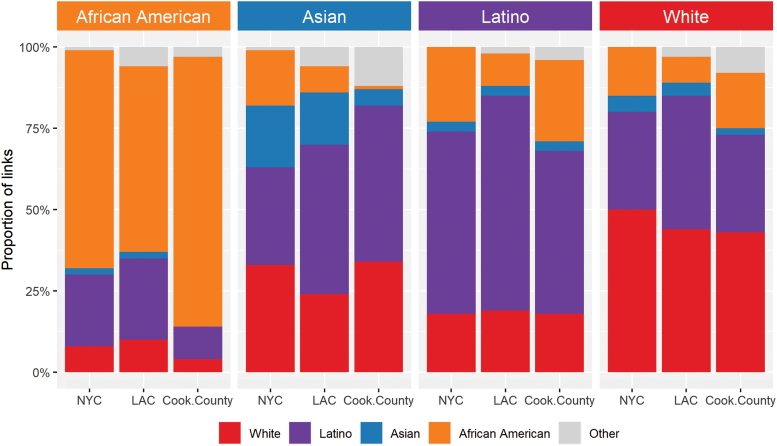
FIG. 3.
Estimated proportion of potential partners from each race/ethnic group in NYC, LAC, and Cook County. Note that the number of individuals in each group varies widely and thus the statistical significance of differences cannot be assessed from these distributions. Color images are available online.

