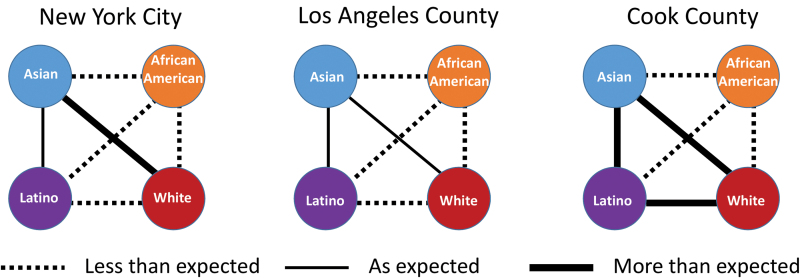
FIG. 4.
Expected/observed number of links between race/ethnicities (African American, Asian, Latino, and white) in each of the three metropolitan areas. Lines between race/ethnic groups indicate whether the numbers observed are lower than expected, as expected, or higher than expected (p < .01). Detailed distributions are available in Supplementary Figures S3–S5. Color images are available online.

