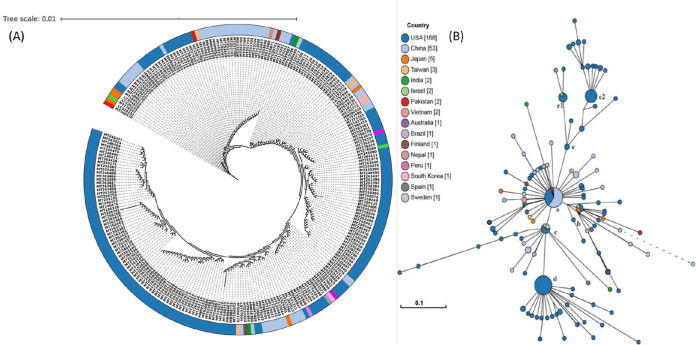
FIG 1.
Phylogenetic network of 245 SARS-CoV-2 genomes. (A) Nucleotide-based phylogenetic analysis of SARS-CoV-2 isolates using the maximum likelihood method based on the Tamura-Nei model. (B) Amino acid-based phylogenomic analysis. Circle areas are proportional to the number of taxa. The map is diverged into five major clades (clades a to e) representing variation in the genomes at the amino acid level. The colored circle represents the country of origin of each isolate.

