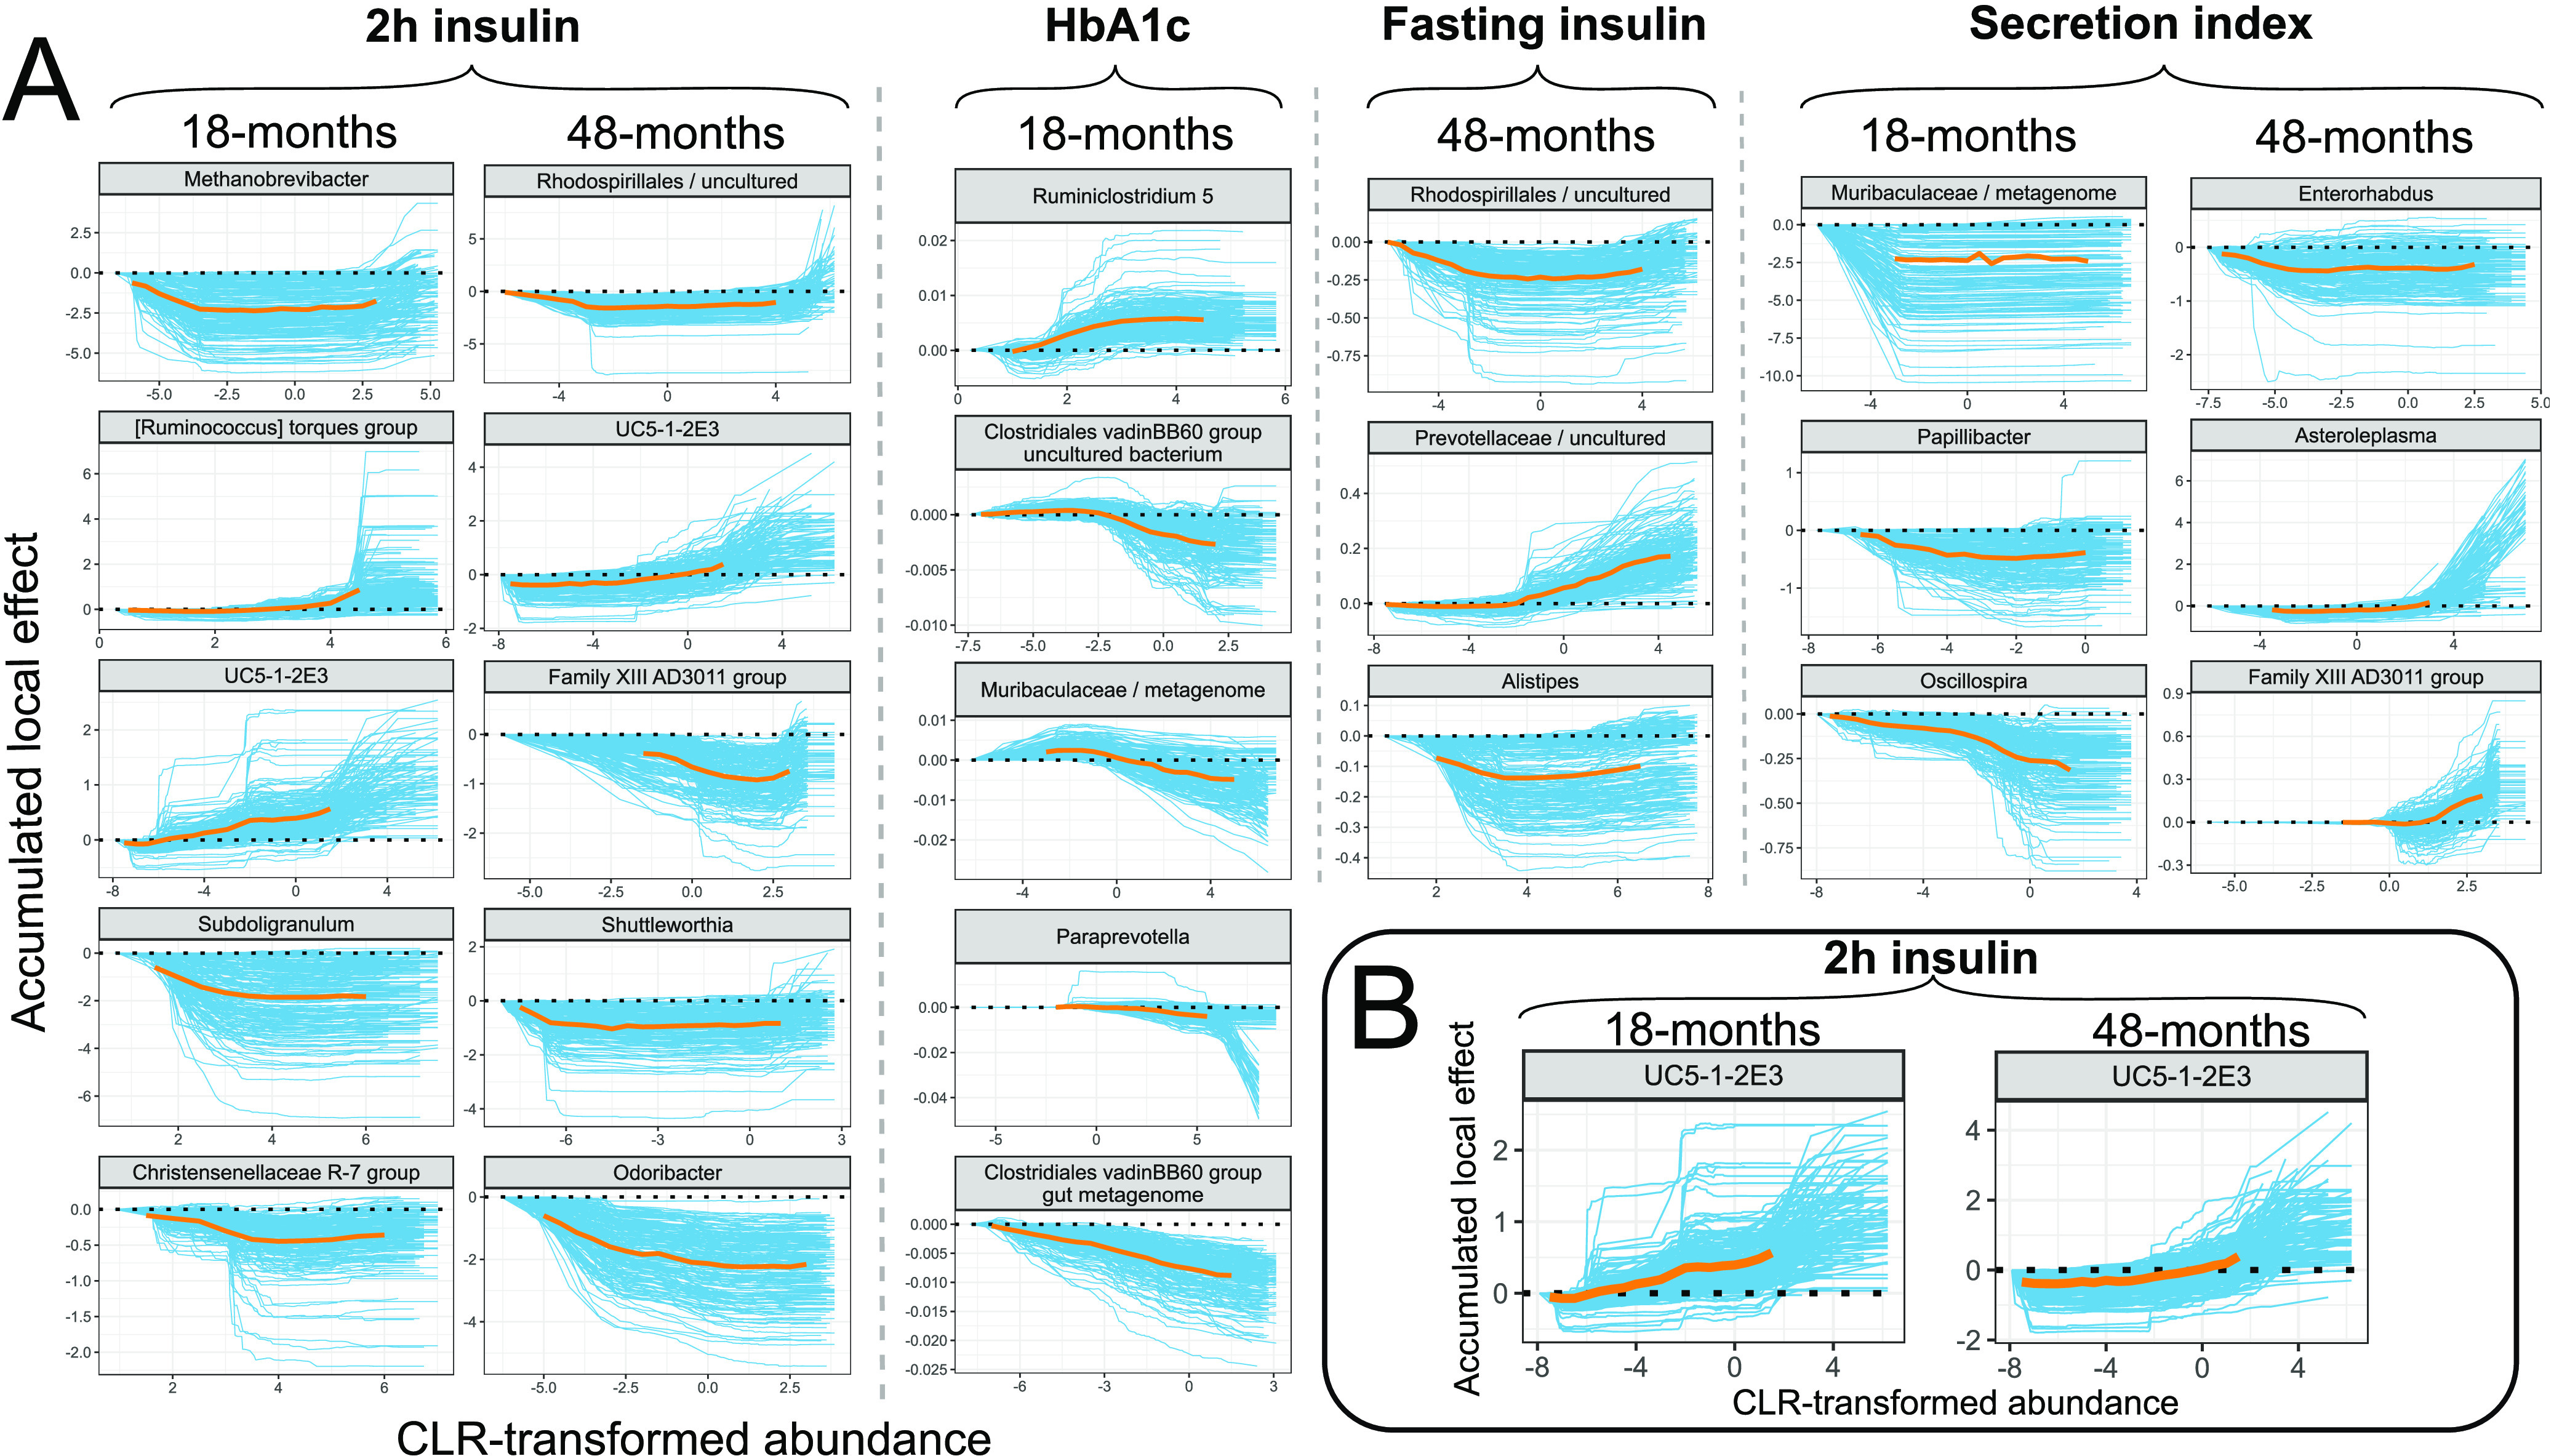
FIG 3.

Accumulated local effect (ALE) plots. (A) ALE plots for the found microbial biomarkers. (B) ALE plots for genus UC5-1-2E3 found to predict 2-h insulin in 18-month and 48-month follow-ups. Blue lines represent effects for each run out of 200; orange lines represent aggregated effects. Aggregated effect is displayed between the 2.5% and 97.5% quantiles of CLR-transformed abundance for the corresponding microbial marker.
