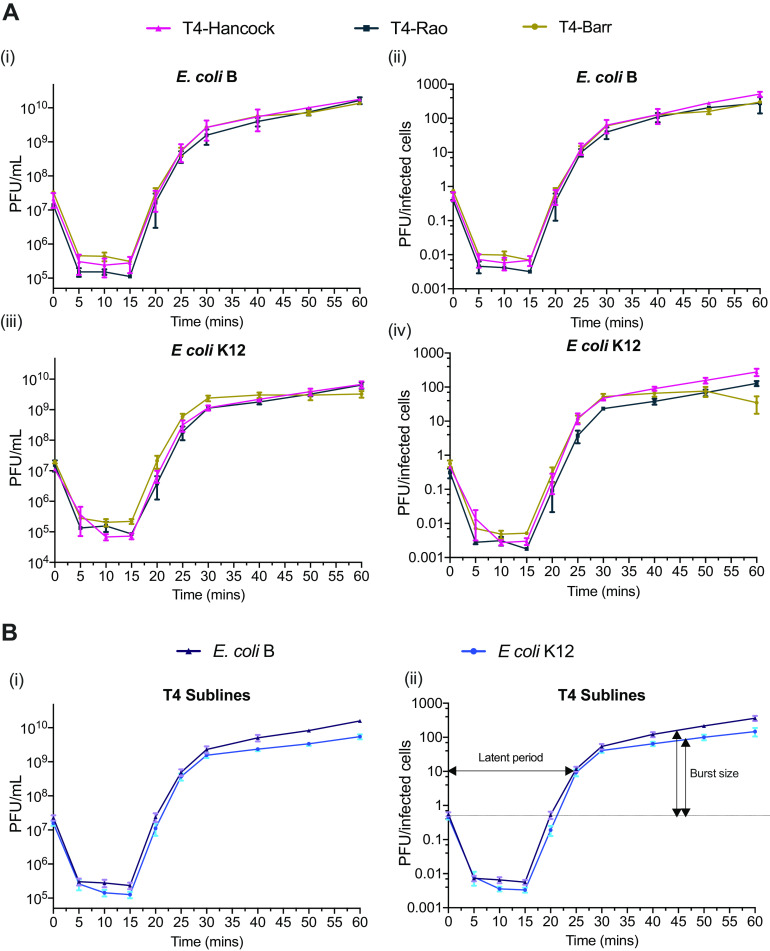
FIG 4.
One-step growth curve of T4 sublines (A) Growth curves of T4 sublines in E. coli B (i and ii) and E. coli K-12 (iii and iv). The values in panels ii and iv were calculated by dividing the number of PFU at each time point by CFU of the initial inoculum. (B) Growth curve representing the averages for all three T4 sublines in E. coli B (i) and E. coli K-12 (ii). All experiments were repeated in triplicate on three separate occasions. Error bars represent standard errors of the mean.

