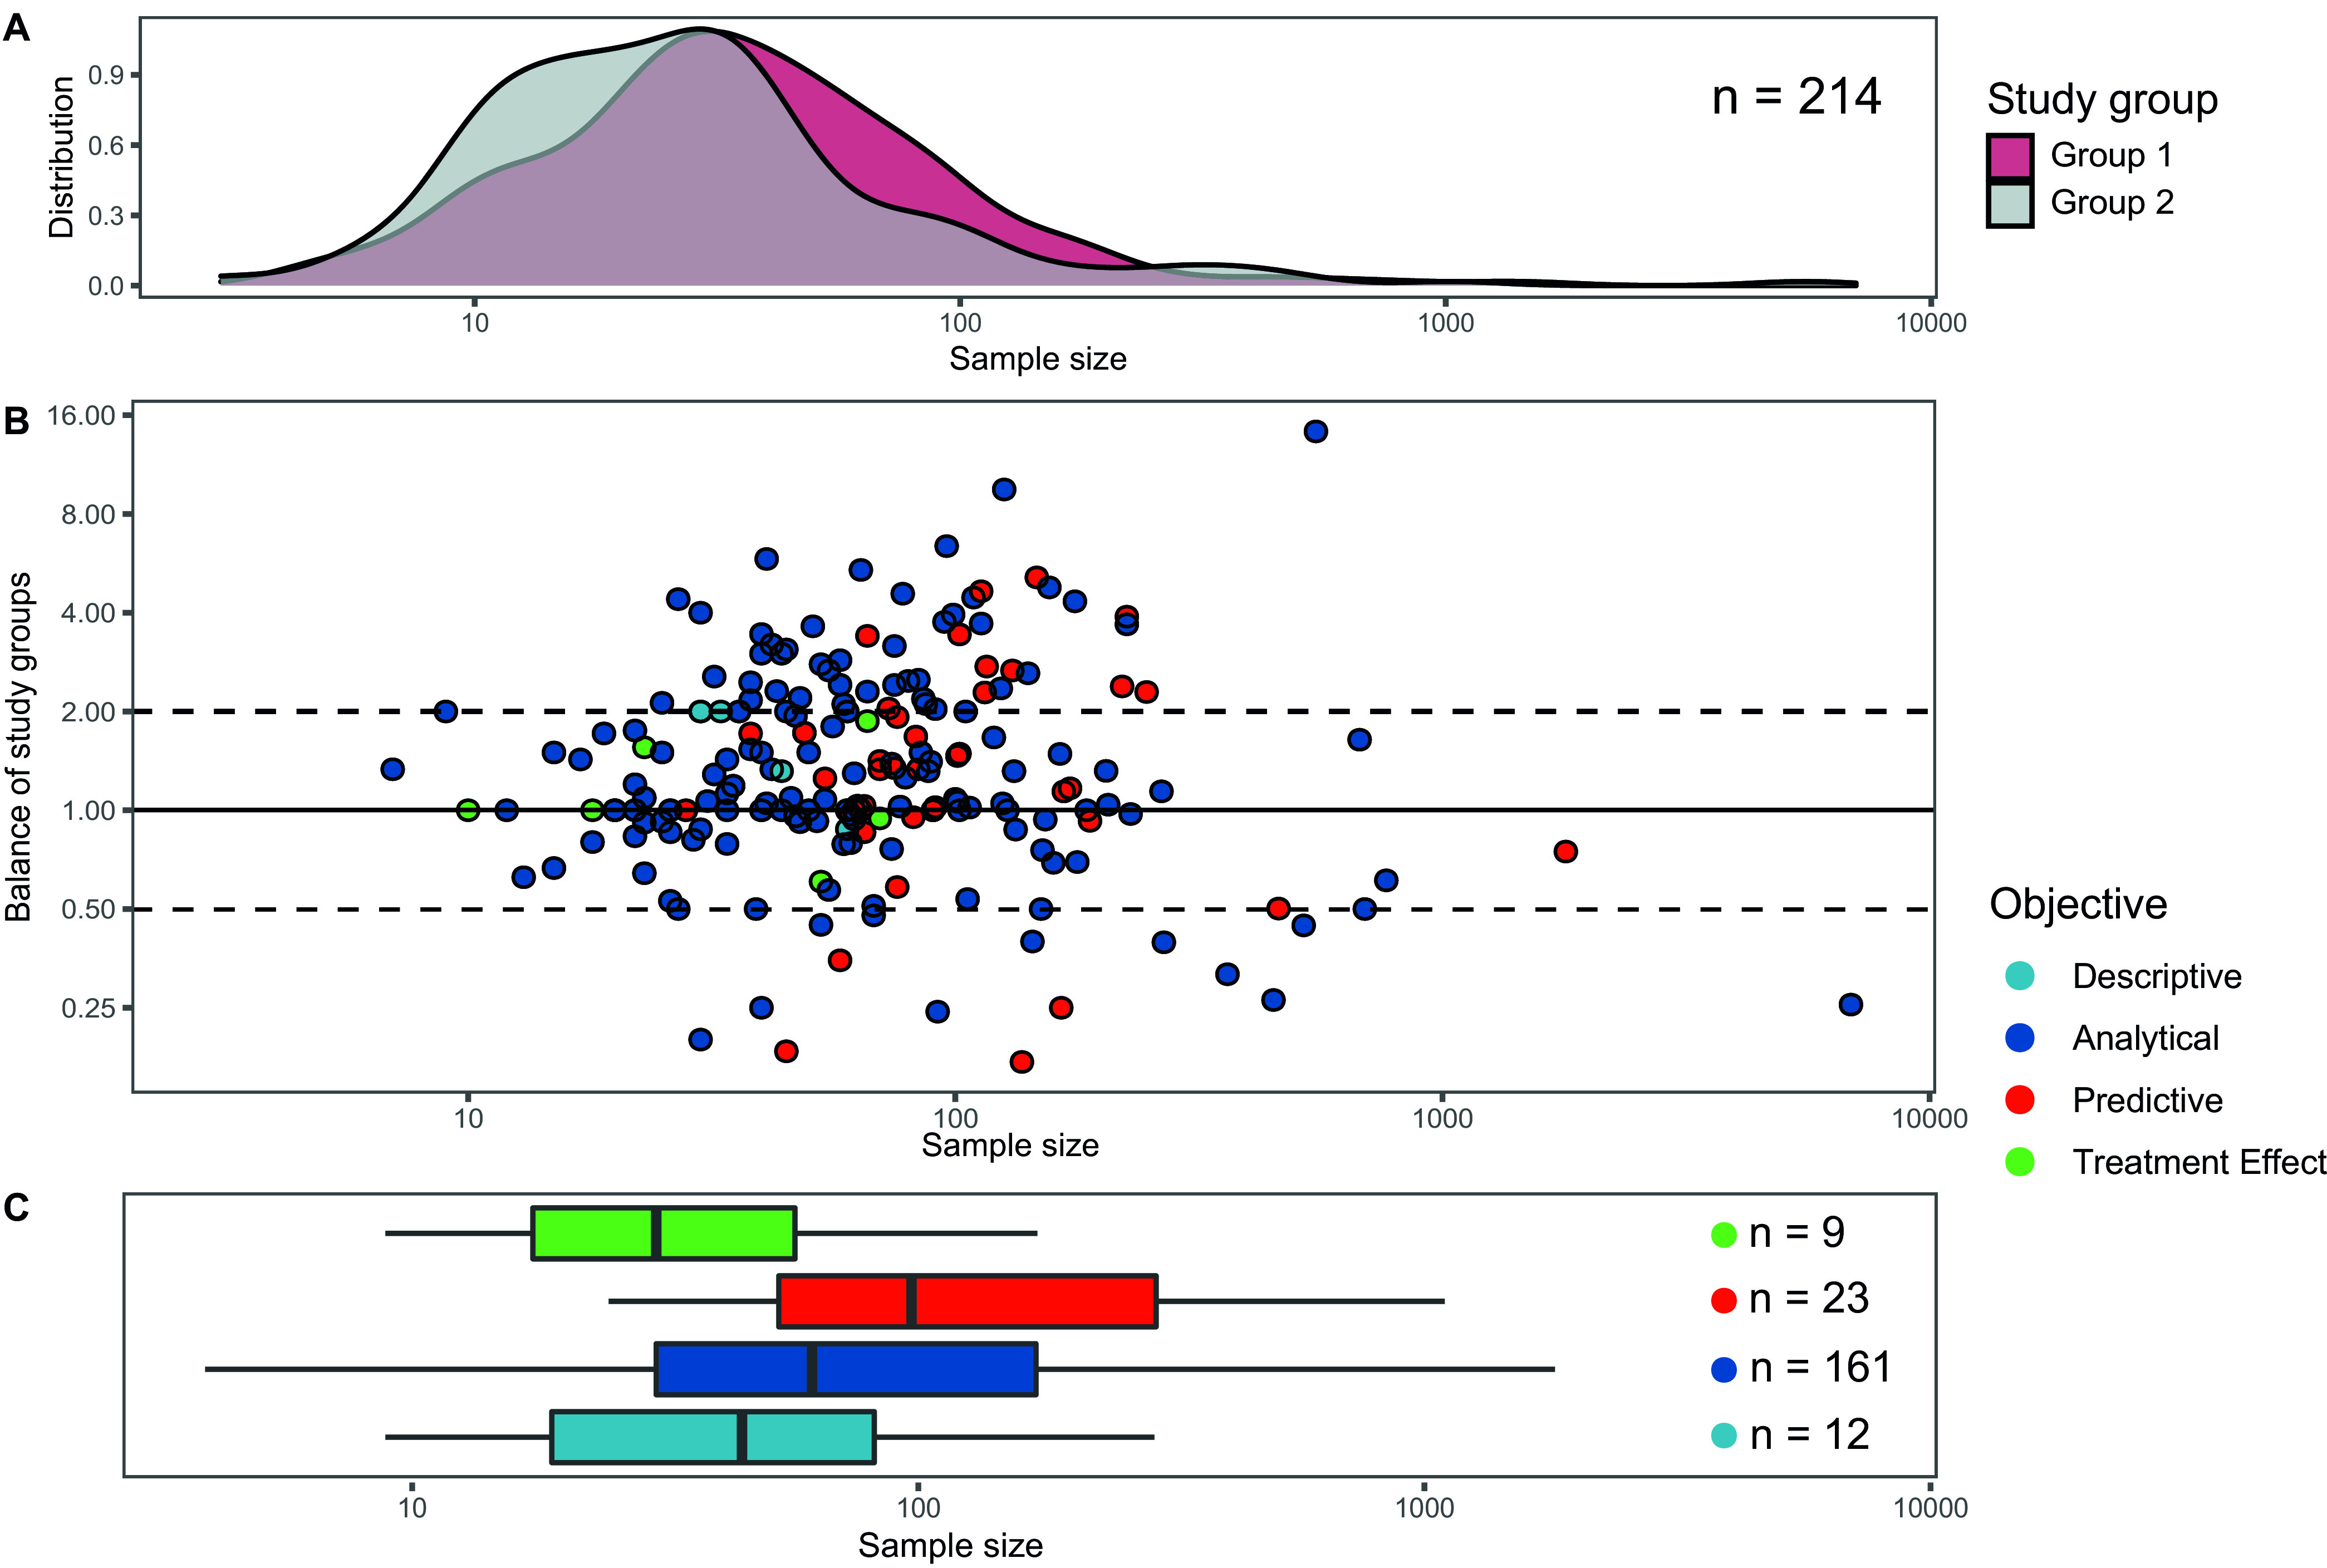
FIG 1.

Sample sizes and balances of study groups. (A) Distribution of sample size stratified by study group. n refers to the number of studies with two study groups. (B) Balance of study groups stratified by research objective. The vertical axis indicates the balance in sample size between study groups, with one representing equal group sizes. Points outside the dashed lines indicate studies in which one study group is at least twice as large as the second study group. Note, only studies with two study groups are presented here. (C) Distribution of sample sizes for studies using only one study group.
