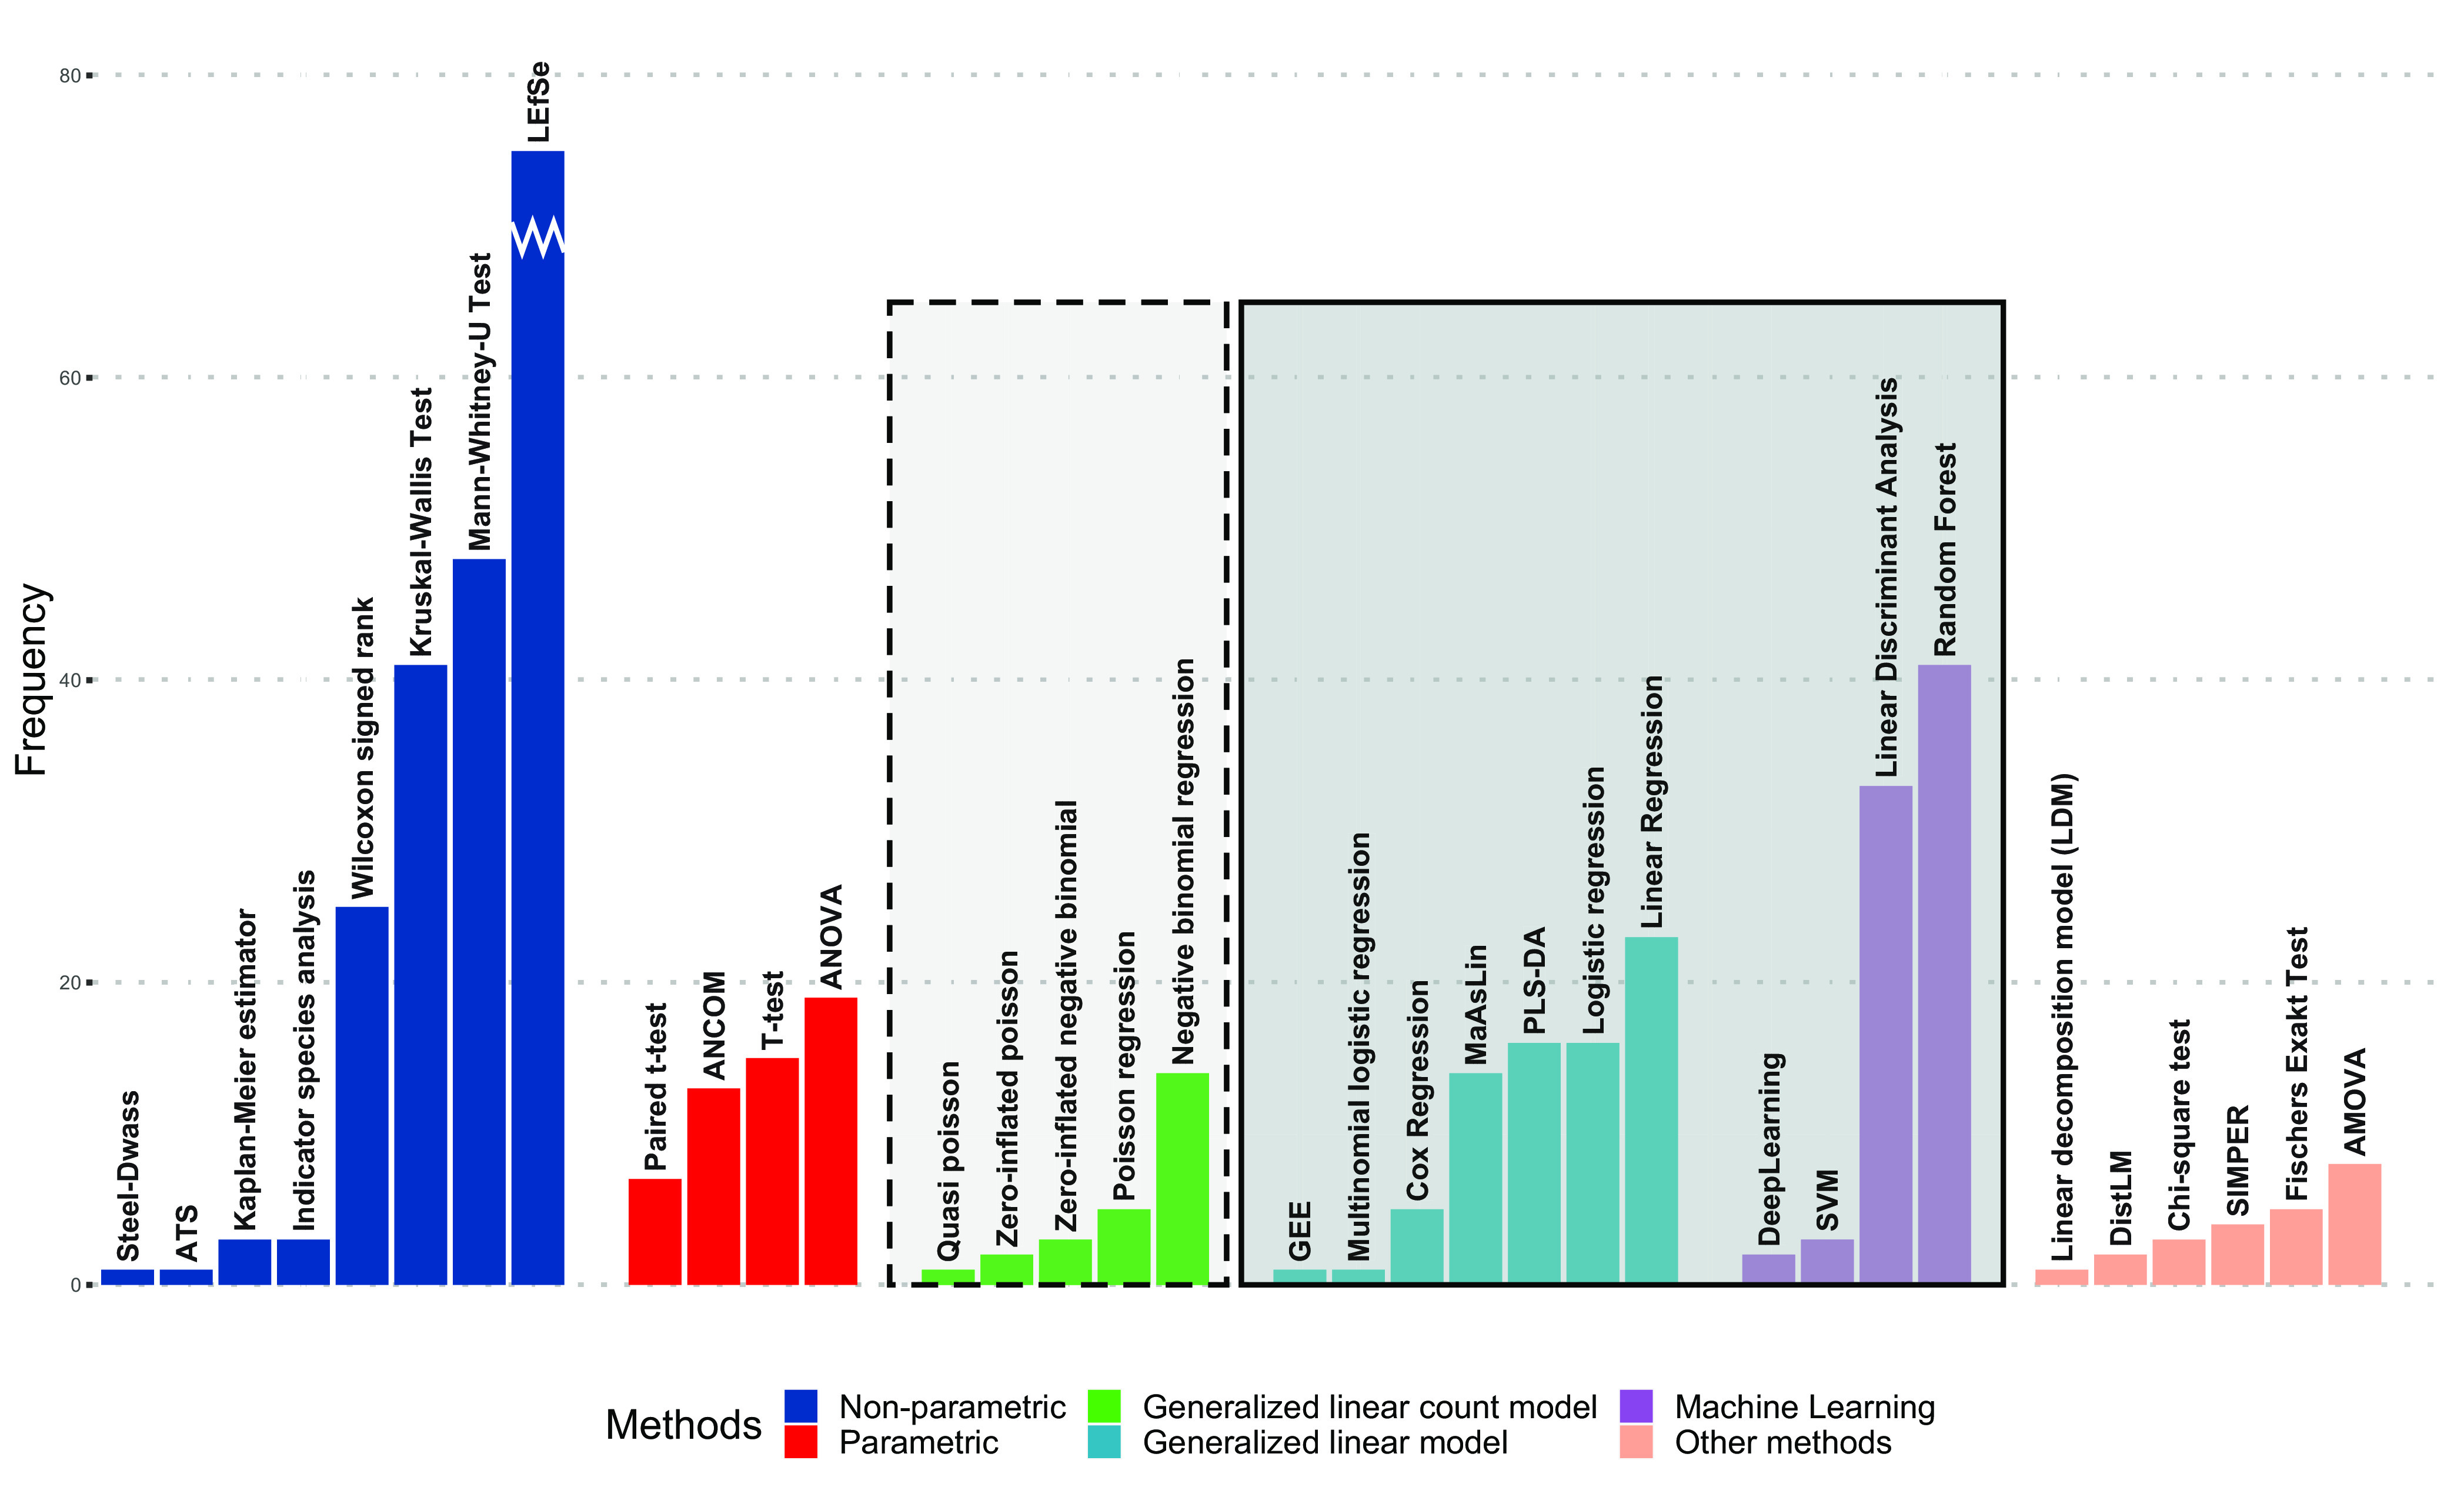
FIG 6.

Bar chart of methods used for differential abundance testing grouped by category. Methods highlighted in dark gray model the microbiome as the independent variable. Methods highlighted in light gray model the microbiome as dependent variable. Note that to improve interpretability of the plot, the bar for LEfSe (n = 132) was truncated to fit into the scale.
