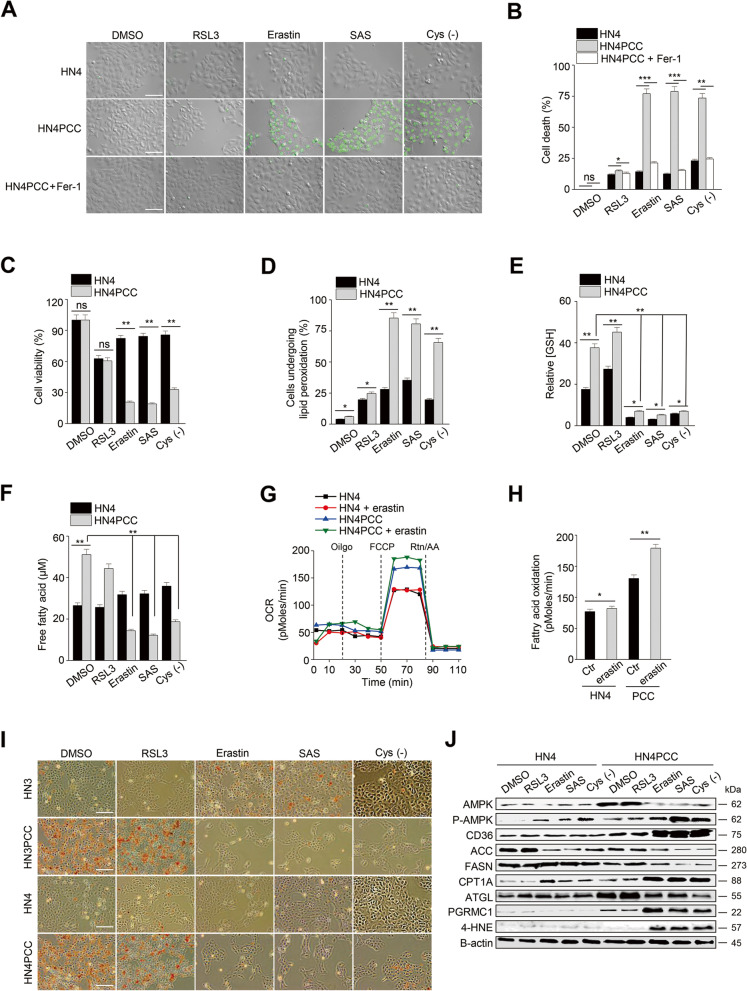
Fig. 2.
PCC is vulnerable to xCT inhibitors. A-C Cell death and viability assays in HN4 parental cells and PCC. Cell death was assessed using SYTOX™ Green stain in the cells treated with or without 2 μM ferrostatin-1 plus 1 μM RSL3, 10 μM erastin, 0.5 mM sulfasalazine (SAS), or cyst(e)ine deprivation for 48 h. Dead cells were quantified by counting SYTOX Green positive cells. Cell viability was examined using a CCK-8 assay. Scale bar 100 μm. Data are means and s.d. from three technical replicates. ns, non-significance; *P < 0.05, **P < 0.01, ***P < 0.001 relative to PCC. D Lipid peroxidation was examined using BODIPY™ C11 and fluorescence-activated cell sorting (FACS) in parental cells and PCC after exposure to the ferroptosis inducers of 1 μM RSL3, 10 μM erastin, 0.5 mM SAS, and cyst(e)ine deprivation for 8 h. *P < 0.05, **P < 0.01 relative to parental cells. E and F Relative glutathione (GSH) and free fatty acid contents in parental cells and PCC after treatment with ferroptosis inducers for 24 h; 1 μM RSL3, 10 μM erastin, 0.5 mM SAS, or cyst(e)ine deprivation. *P < 0.05, **P < 0.01 relative to parental cells. G and H FAO in parental cells and PCC with or without 10 μM erastin was quantified via assessing changes in OCR when exposed to etomoxir or not. *P < 0.05, **P < 0.01 relative to parental cells. I and J Oil red O staining and immunoblotting in parental cells and PCC after treatment with ferroptosis inducers for 24 h; 1 μM RSL3, 10 μM erastin, 0.5 mM SAS, and cyst(e)ine deprivation. Scale bar 100 μm

