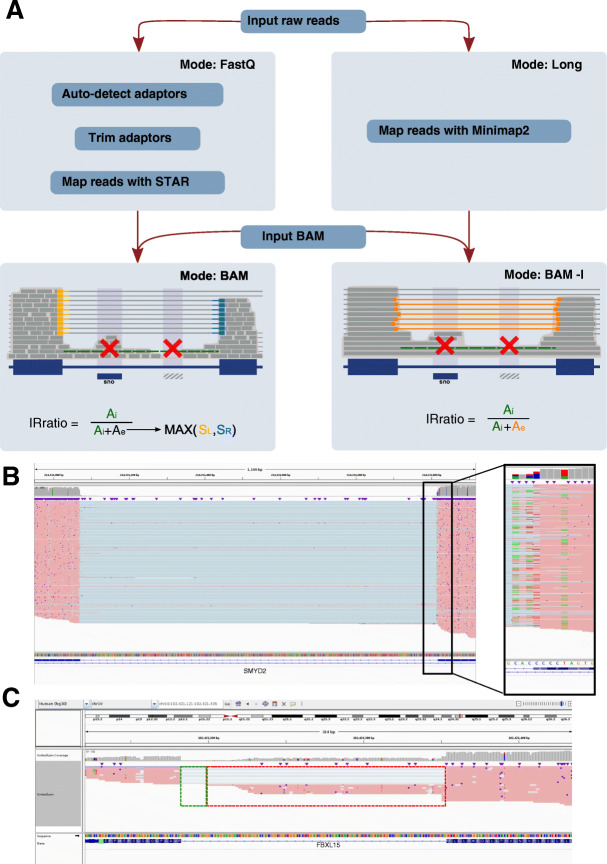
Fig. 2.
IRratio estimation for long reads. A Main changes in the pipeline between short reads (left) and long reads (right). Ai = intron abundance and Ae = exon abundance. In short reads, Ai is estimated as the median value of the intron depth; in long reads, we use the minimum intron depth. The exon abundance in short reads is estimated as the maximum value between the number of reads spliced at the 5′ or 3′ of the intron; in long reads, it is the number of reads that are spliced in 5′ and 3′. Red crosses indicate regions that will be excluded from further analysis either due to other overlapping transcripts (left cross) or low mappability regions (right cross). Green lines indicate intronic abundance (Ai). B Example of poor alignment to exonic borders due to sequencing errors that creates a jitter effect on the mapping of long reads around the splice junctions. Without jitter (option -j 0), the software identifies only 110 SpliceLeft reads, 0 SpliceRight, and 0 ExactSplice. With the jitter option (-j 3), it identifies 183 SpliceLeft reads, 210 SpliceRight reads, and 69 ExactSplice. Having an intron abundance (Ai) of 4 and using the ExactSplice as Ae, the IRratio in the first case is 1 and it raise the LowCover warning; in the second case, the IRratio is 0.055, raising the MinorIsoform warning due to the imbalance between the ExactSplice and the max(SpliceLeft, SpliceRight)”. C Example of alternative 3′ end that is considered as intron retention by the standard method (IRratio=0.40, due to the reads in the red box that do not extend fully between the two exons) and not by the long read mode (IRratio=0, due to the absence of reads covering the green and red boxes)

