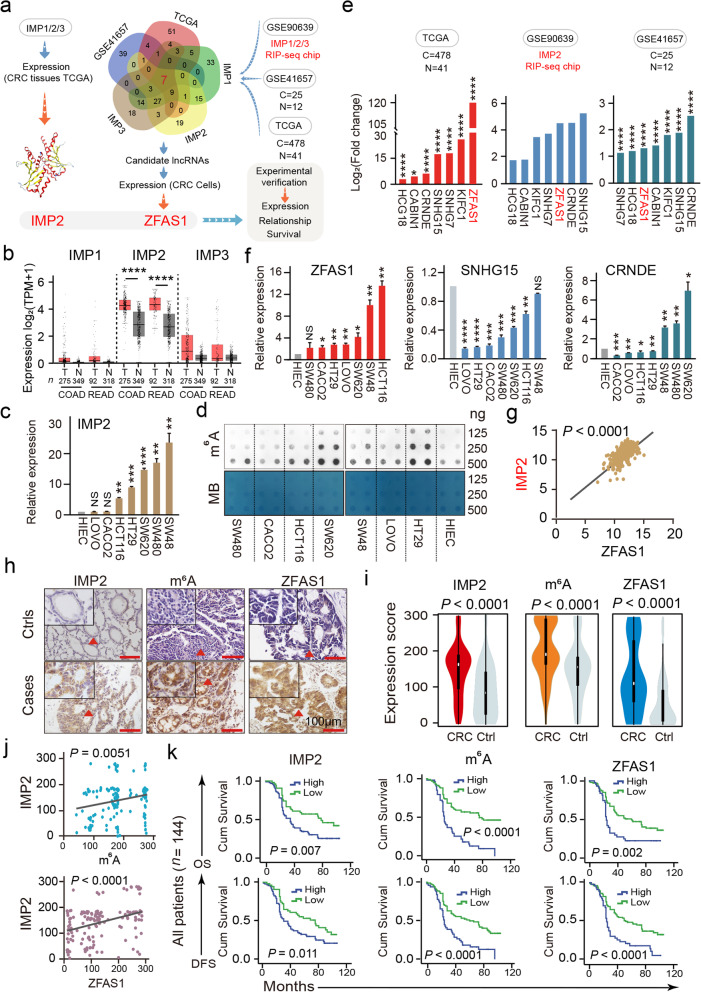
Fig. 1.
The relationship of IMP1/2/3 with lncRANs expression in CRC cells and patient tissues. a The screening strategy of IMP2 and its downstream target ZFAS1. b Expression of IMPs in COAD and READ tissues. c The RNA expression levels of IMP2 in normal control cell HIEC and CRC cells including HCT116, SW620, SW480, LOVO, HT29, CACO2, and SW48 are detected by the qPCR assays. d The m6A expression levels in normal control cell HIEC and CRC cells including HCT116, SW620, SW480, LOVO, HT29, CACO2, and SW48 are detected by the m6A dot blot assay. e The expression of ZFAS1, SNHG15, CRNDE, CABIN1, HCG18, KIFC1 and SNHG7 in CRC in TCGA database and GEO database (GSE90639, GSE41657). f The RNA expression levels of ZFAS1, CRNDE and SNHG15 in normal control cell HIEC and CRC cells including HCT116, SW620, SW480, LOVO, HT29, CACO2, and SW48 are detected by the qPCR assays. g Linear correlation pattern showing a positive relationship between the expression of IMP2 and ZFAS1 based on TCGA dataset. h ISH method detected the cellular localization and the expression of ZFAS1, and IHC assay determined m6A and IMP2 expression based on this included CRC patient tissues and matched tumor-adjacent controls (n = 144). The bar represents 100 μm. i Violin charts displaying the expression levels of IMP2, m6A, and ZFAS1 in this included CRC cohort. Nonparametric tests and median (interquartile range) were shown. j Linear correlation pattern showing a positive relationship between the expression of IMP2, m6A, and ZFAS1. k Kaplan–Meier plot curves showing the association of IMP2 high/low expression, m6A high/low expression, and lncRNA ZFAS1 high/low expression with the OS and DFS in this included CRC patients. Data were shown as mean ± s.d. of at least three independent experiments. *P < 0.05; **P < 0.01; ***P < 0.001; ****P < 0.0001 and ns no significance

