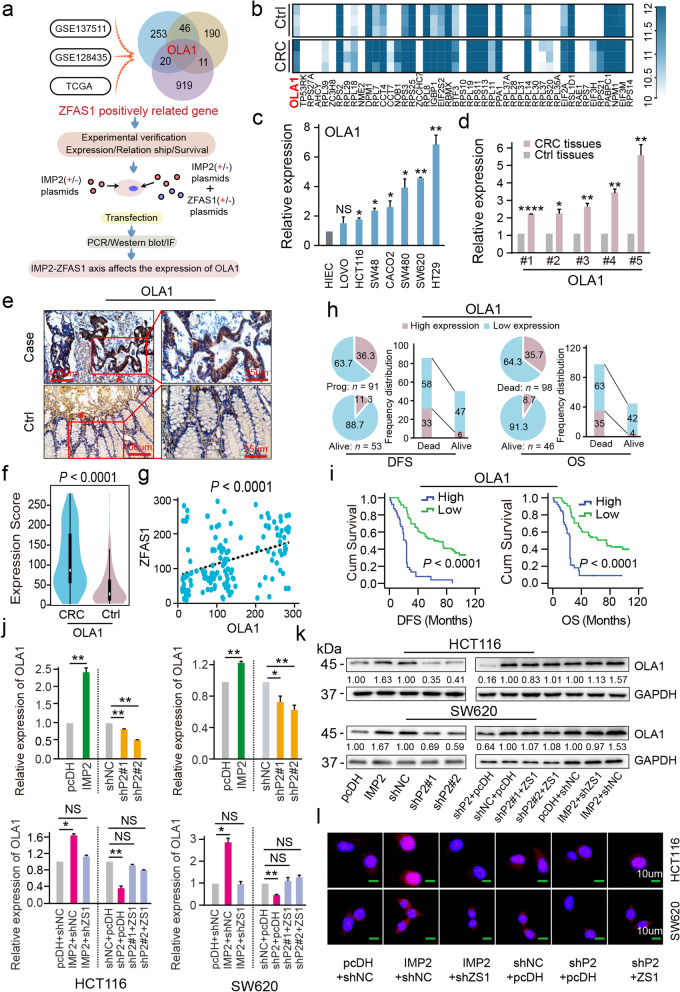
Fig. 4.
OLA1 is the critical downstream target of ZFAS1 stabilized by IMP2 in CRC cells. a Flow chart of ZFAS1 downstream target OLA1 screening and validation of the correlation between ZFAS1 and OLA1 b The heat map illustrating the differentially expressed mRNAs in matched tumor-adjacent controls and matched CRC samples (P < 0.05). c The RNA expression levels of OLA1 in normal control HIEC cells and CRC cells including HCT116, SW620, SW480, LOVO, HT29, CACO2, and SW48 are detected by qPCR assays. d The RNA expression levels of OLA1 in paired tumor-adjacent control tissues and CRC samples (n = 5) detected by qPCR assays. e IHC assays displaying OLA1 expression in our included cohorts (n = 144). The bar represents 100 μm. f Violin charts displaying the expression levels of OLA1 in this included CRC cohort. Nonparametric tests and median (interquartile range) were shown. g Linear correlation pattern showing a positive relationship between the expression of ZFAS1 and OLA1. h Pie chart and bar chart showing the frequency and percentage of OLA1 high/low expression patients in DFS/OS status is dead/alive patients. i Kaplan–Meier plot curves showing the association of OLA1 high/low expression with the OS and DFS in this included CRC patients. j The expression of OLA1 after interfering with IMP2 alone or interfering with IMP2 and ZFAS1 at the same time in CRC cells by qPCR. k Western blot detecting the protein levels of OLA1 after interfering with IMP2 alone or interfering with IMP2 and ZFAS1 at the same time in CRC cells. l IF method illustrating the protein levels of OLA1 after interfering with IMP2 alone or interfering with IMP2 and ZFAS1 at the same time in CRC cells. Data were shown as mean ± s.d. of at least three independent experiments. *P < 0.05; **P < 0.01; *** P < 0.001; **** P < 0.0001 and ns no significance

