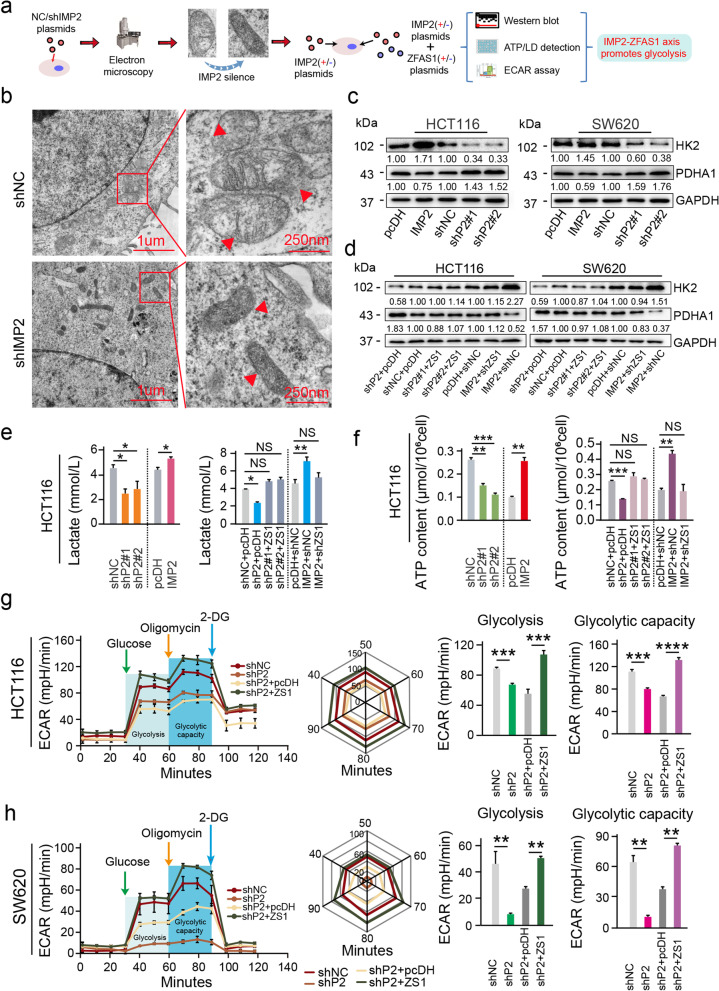
Fig. 6.
Mitochondrial energy metabolism was affected by the IMP2-ZFAS1-OLA1 signaling axis. a Flow chart of validation of IMP2-ZFAS1-OLA1 axis on energy metabolism. b Morphology of mitochondria under electron microscope after knockdown IMP2 in HCT116 cells. c Western blot detecting the protein levels of mitochondrial associated protein HK2 and PDHA1 expression after interfering with IMP2 expression in both HCT116 and SW620 cells. d Western blot assays detecting the protein levels of mitochondrial associated protein HK2 and PDHA1 after co-transfected with shIMP2 upon ZFAS1 overexpression or IMP2 overexpression and shZFAS1 vectors in HCT116 and SW620 cells. e, f Rescue experiments detecting the lactate content and ATP content treated by co-transfected with shIMP2 upon ZFAS1 overexpression or IMP2 overexpression and shZFAS1 vectors in HCT116 cells. g ECAR experiment verifying the effects of IMP2 and ZFAS1 on glycolysis of CRC cells. Data were shown as mean ± s.d. of at least three independent experiments. *P < 0.05; **P < 0.01; *** P < 0.001; **** P < 0.0001 and ns no significance

