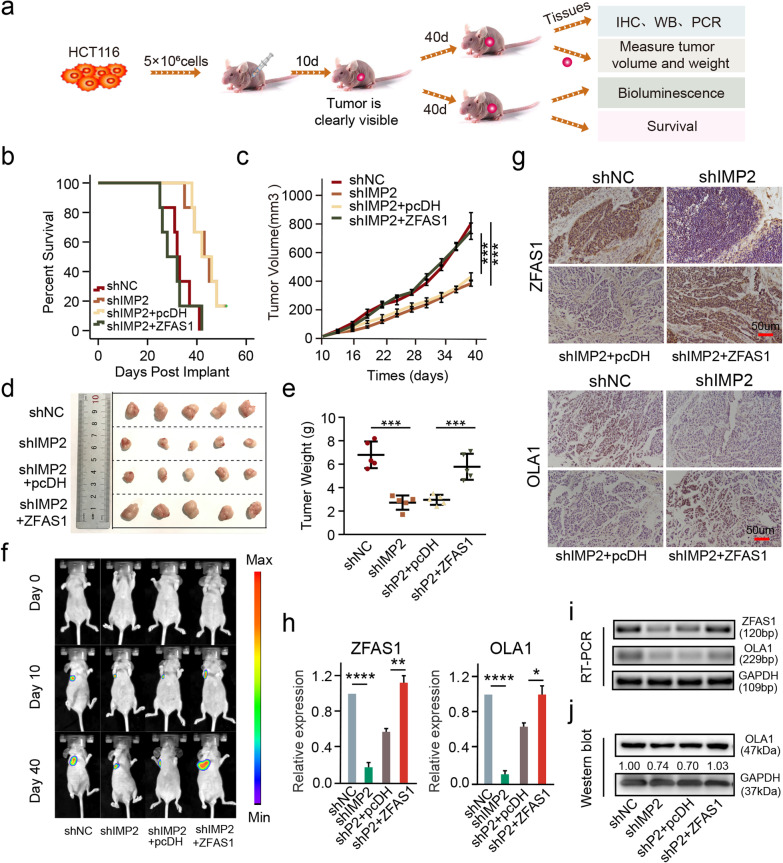
Fig. 7.
IMP2 promotes cell proliferation by stabilizing ZFAS1 in vivo. a Schematic diagram of xenografts in BALB/c nude mice by inoculating HCT116 cells at their right armpits that were stably co-transfected with shNC, shIMP2, shIMP2 + pcDH, shIMP2 + ZFAS1, respectively. b The survival time for each group xenografts in nude mice. c Mean volumes of xenografts on different days in nude mice. Data are shown as mean ± s.d., n = 5 for each group. d Representative xenografts are shown when excised on the 40th day. e Mean weight of xenografts for each group was determined on the 40th day. Data are shown as mean ± s.d., n = 5 for each group. f Tumor size of xenograft tumor at day 0, day 10, and day 40. g ISH and IHC assays were performed to determine the protein expression of ZFAS1 and OLA1 above each group. h, i qPCR and RT-PCR assays were performed to determine the RNA expression of ZFAS1 and OLA1 in each group. j Western blot assay detecting the protein expression of OLA1 upon each group. The groups were as follows: shNC (empty vector); shIMP2; shIMP2 + pcDH (co-transfected with shIMP2 and pcDH empty vector); shIMP2 + ZFAS1 (co-transfected with shIMP2 and pcDH-ZFAS1). Data were shown as mean ± s.d. of at least three independent experiments. *P < 0.05; **P < 0.01; *** P < 0.001; **** P < 0.0001 and ns no significance

