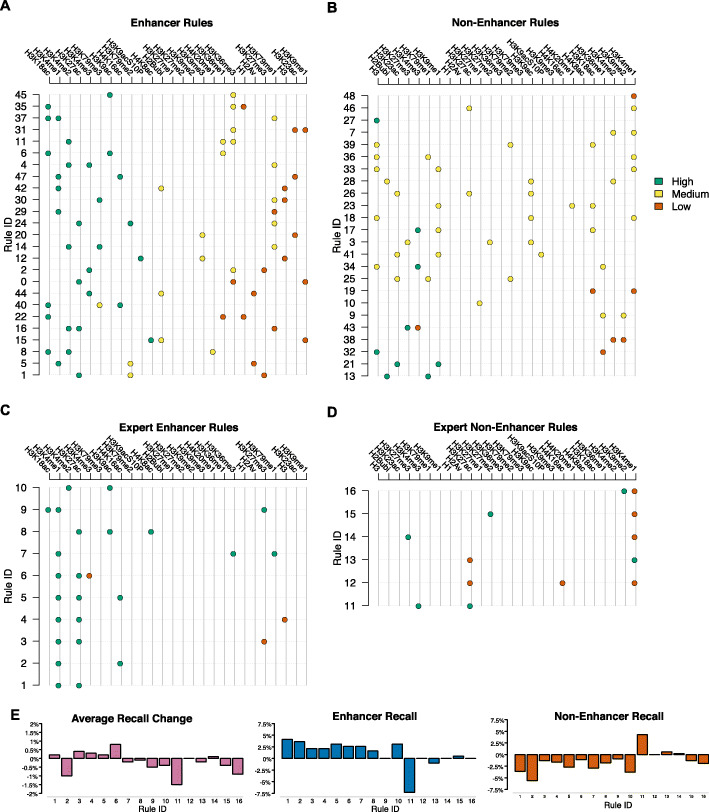
Fig. 4.
Rules explaining enhancer and non-enhancer classification. Individual rules are horizontal lines on the plot and include up to three epigenetic marks per rule. The colour code represents classification of an epigenetic mark as high (green), medium (orange), or low (red). A Rules involved in predicting bins as belonging to enhancers. B Rules that contribute to predicting bins not belonging to enhancers (non-enhancer). C, D expert rules for enhancers (C) and non-enhancers (D). E Evaluation of the expert rules. We plot the recall for enhancers and non-enhancers and the average recall.

