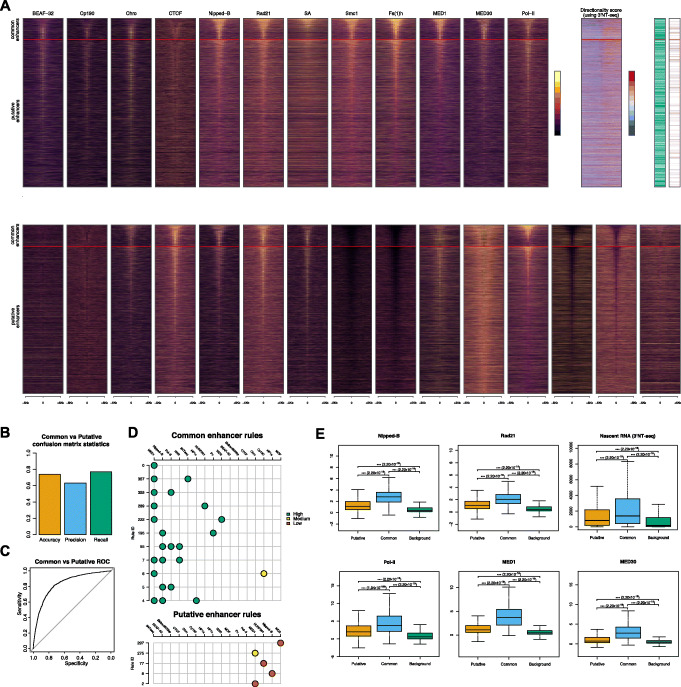
Fig. 6.
Enrichment of chromatin features at enhancers in BG3 cells. A We ordered enhancers based on their size (starting with largest at the top) and split them in common and putative enhancers. We plot profiles ± 5 Kb around the centre of enhancers for: architectural proteins (BEAF-32, Cp190, Chro, CTCF, Nipped-B, Rad21, SA, Smc1, Fs(1)h, MED1 and MED30), transcription (Pol II and 3'NT-seq), polycomb and heterochromatin (Pc, HP1a and HP1c), nucleosome remodelling (ISWI, MOF, WDS and NURF301), epigenetic factors (H3, H4, H3K4me3, H3K4me1, H3K27ac, H3K36me3, H3K79me1 and H4K16ac). We used 3′NT-seq to call bidirectional enhancers (see Materials and Methods), marked by a green bar, and also plot the directionality score as the log10 ratio of the nascent RNA signal on the positive and negative strands (with red indicating higher expression on positive strand and blue higher expression on the negative strand). We also marked by purple if there are any TAD borders within 2 Kb, using TAD borders annotation in BG3 cells from [35]. B Confusion matrices statistics from individual bin predictions. Accuracy, precision, and recall were computed and plotted for the XAI model (see Fig. 1). C ROC curve for common vs putative trained model. D All dominance 3 and higher rules generated after training a model to identify common vs putative enhancers. Individual rules are horizontal lines on the plot and include up to three epigenetic marks per rule. The colour code represents classification of an epigenetic mark as high (green), medium (orange), or low (red). E The 95th percentile score across the body of each common and putative enhancer was plotted. Mann-Whitney U test scores can be found on each plot for each group comparison

