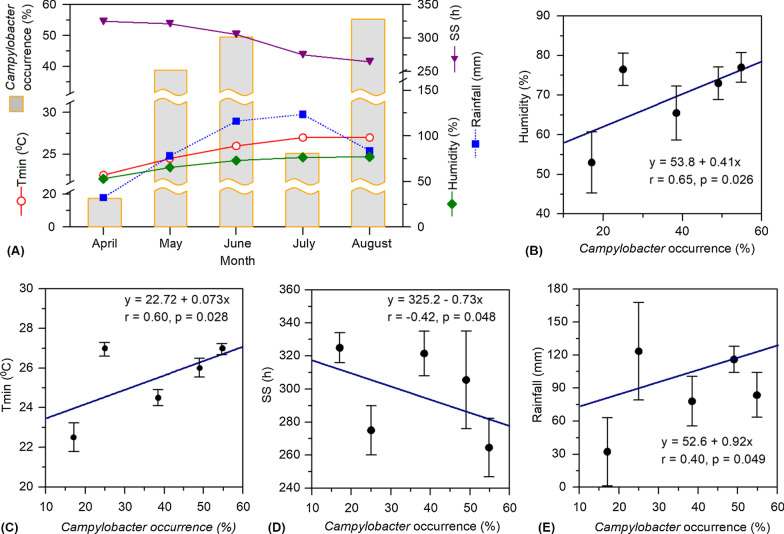
Fig. 3.
Influence of climatic factors on the occurrence of Campylobacter spp. in samples collected from the selected duck farms. A Monthly variations in the mean values of the climatic factors and Campylobacter abundance in different samples of the duck farms. Each of the mean values was computed as the average of daily values of the month compared and its preceding one. The monthly occurrences of Campylobacter spp. represent the bacterial overall isolation rate (% abundance) for different types of samples, i.e., cloacal swab (n = 20–50), egg surface swab (n = 10–25), soil of the duck resting places (n = 5–14) and drinking water (n = 5–14). B–E Correlations between the occurrence of Campylobacter spp. and climatic factors. In each figure, the diagonal line represents linear regression between the two parameters, and the relevant statistical information, including regression equation, r- and p-values are shown for each correlation. Standard deviations of the mean values of each climatic factor are shown as vertical bars. Tmin and SS indicate temperature minimum and sun shine hours, respectively

