. 2021 Oct 25;301(2):250–262. doi: 10.1148/radiol.2021204288

Figure 3:

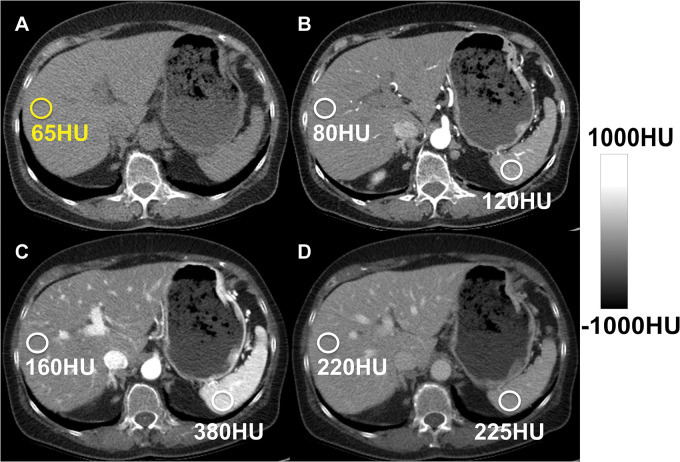
Hepatic steatosis can be quantified using the absolute unenhanced CT attenuation measured in Hounsfield units. Relative liver-spleen Hounsfield unit difference can be used when iodinated contrast material has been administered. An important pitfall to avoid is use of arterial phases where the spleen enhances earlier than the liver, which could be mistaken for hepatic steatosis using the spleen as the reference. CT scans obtained in a patient (A) before and (B–D) after contrast material administration in the arterial (B), late arterial (C), and portal venous (D) phases. No steatosis is seen on unenhanced CT scan (65 HU) (A). CT scans obtained in early (B) and late (C) arterial phase show liver Hounsfield unit is 40 HU and 220 HU less, respectively, than that in the spleen, mimicking steatosis. In portal venous phase (D), attenuation of liver and spleen is essentially equal.

Hepatic steatosis can be quantified using the absolute unenhanced CT attenuation measured in Hounsfield units. Relative liver-spleen Hounsfield unit difference can be used when iodinated contrast material has been administered. An important pitfall to avoid is use of arterial phases where the spleen enhances earlier than the liver, which could be mistaken for hepatic steatosis using the spleen as the reference. CT scans obtained in a patient (A) before and (B–D) after contrast material administration in the arterial (B), late arterial (C), and portal venous (D) phases. No steatosis is seen on unenhanced CT scan (65 HU) (A). CT scans obtained in early (B) and late (C) arterial phase show liver Hounsfield unit is 40 HU and 220 HU less, respectively, than that in the spleen, mimicking steatosis. In portal venous phase (D), attenuation of liver and spleen is essentially equal.