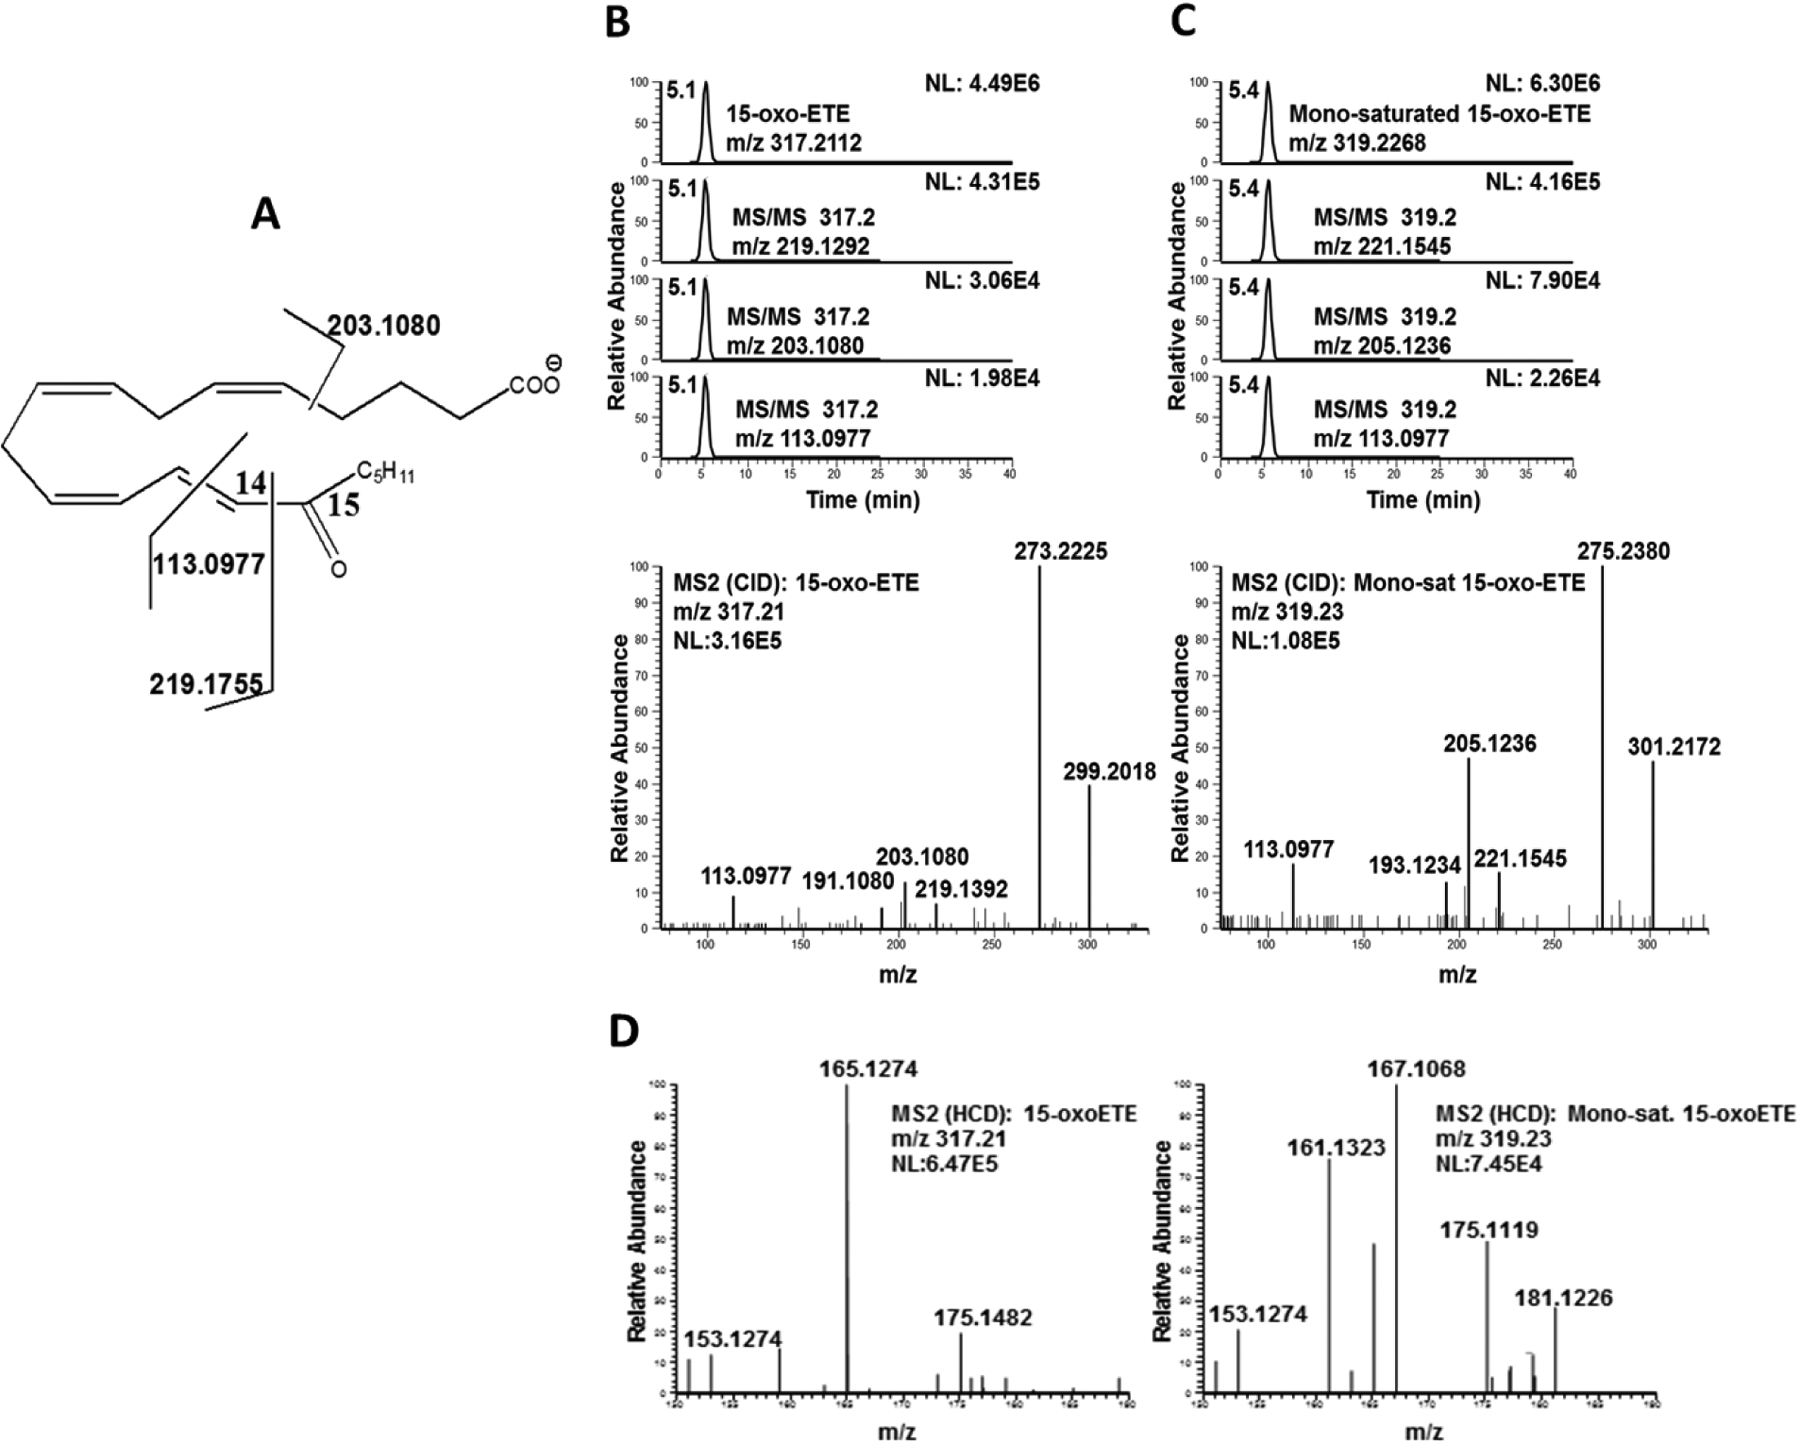
Figure 4: LC-MS/HRMS confirmation of the 15-oxoETE saturation product.

(A) 15-oxoETE structure and diagnostic fragmentation. Extracted chromatograms and product ion spectrum in negative ion mode for (B) 15-oxoETE and (C) the mono-saturated 15-oxoETE metabolite. (D) Product ion spectra of 15-oxoETE and the mono-saturated 15-oxoETE metabolite between m/z 150–190 to highlight the fragmentation found at m/z 165.1274 for 15-oxoETE and m/z 167.1068 for the mono-saturated 15-oxoETE metabolite. The m/z of 167.1068 corresponds to fragmentation of the chemical composition C10H15O2, a fragment adjacent to the C8-C9 double bond that would likely not be present if saturation occurred at this position.
