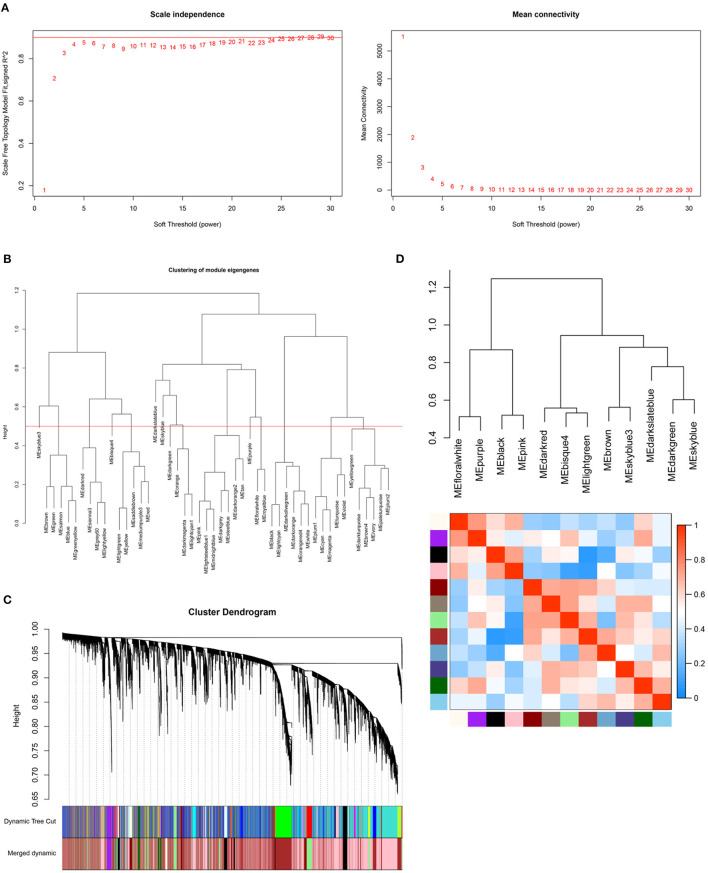
Figure 2.
Construction of weighted gene co-expression network. (A) Analysis of the scale-free topology model fit index for soft threshold powers (Left) and analysis of the mean connectivity for soft threshold powers (Right). The soft-thresholding power was set as four. (B) Clustering of module eigengenes. The red line represents cut height (0.5). (C) The cluster dendrogram of genes. (D) The cluster dendrogram and adjacency heatmap of eigengenes.

