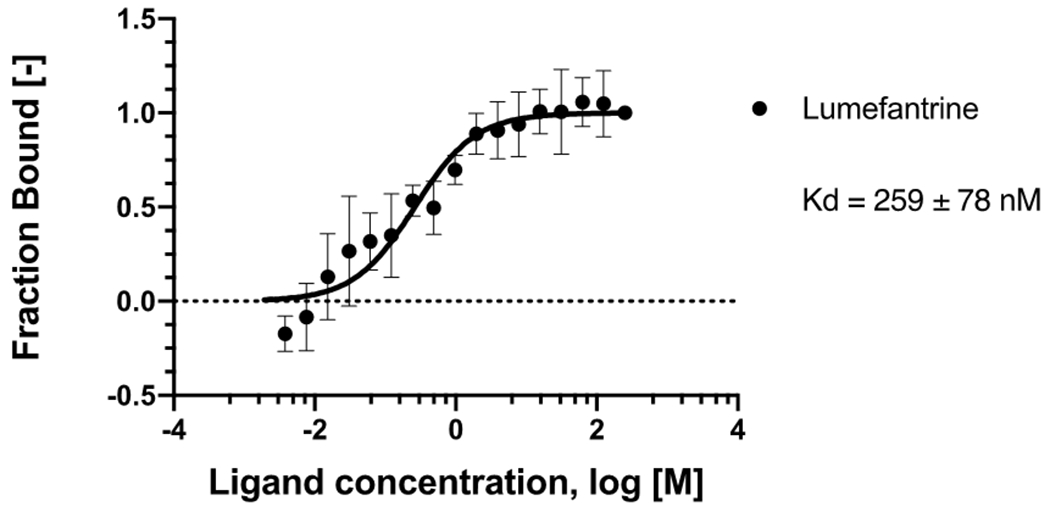
Figure 2.

MicroScale Thermophoresis binding analysis for the interaction between Spike RBD and lumefantrine. The concentration of labeled Spike RBD was maintained at 5 nM, and the ligand concentration varied from 125 μM to 3.8 nM. The serial titrations result in measurable changes in the fluorescence signal within a temperature gradient that was used to calculate the dissociation constant (Kd = 259 ± 78 nM). The curve is shown as Fraction Bound [-] against lumefantrine concentration on a log scale.
