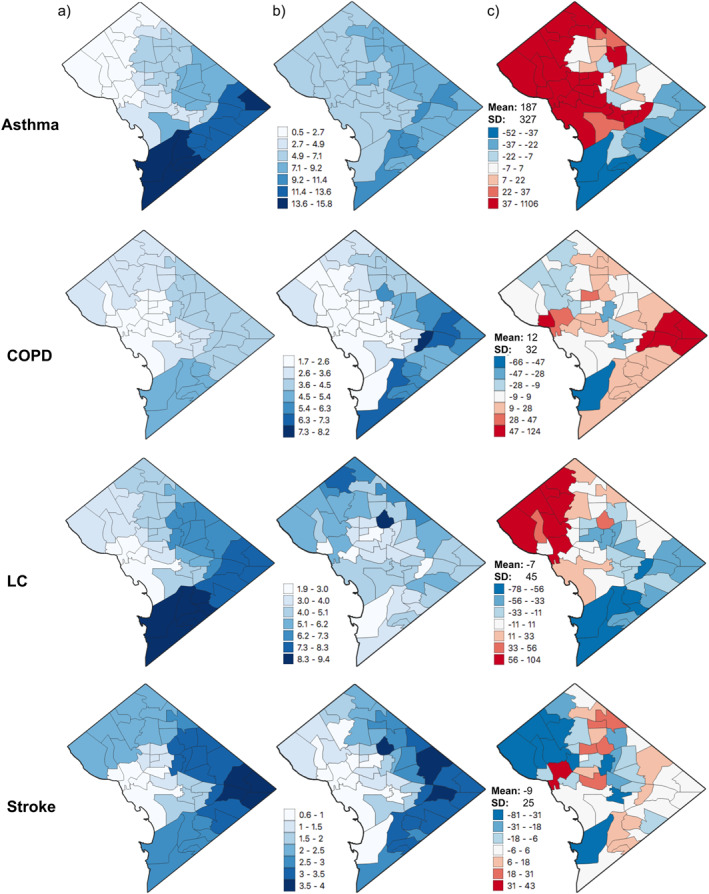
Figure 5.

Neighborhood‐level PM2.5‐attributable rates for asthma ED visits (Asthma) per 10,000 people and PM2.5‐attributable mortality rates for COPD, lung cancer (LC) and stroke per 100,000 people using (a) DOH disease rates and (b) the integrated CDC‐DOH disease rates, and (c) percent difference between (a and b) [(CDC‐DOH ‐ DOH)/DOH]. Results are aggregated to neighborhood scale for all health outcomes, though DOH disease rate inputs for panel (a) are at zip code level for asthma ED visits and ward level for COPD, lung cancer, and stroke.
